◄ Carnets Geol. 14 (2) ►
![]()
Contents
[1. Introduction] [2. Methodology of calibrating Cretaceous biostratigraphic data]
[3. Results]
[4. Conclusions] [Bibliographic references] [Appendices]
Precision Stratigraphy Associates & The University of Tulsa, 149 West Ridge Road, Cleveland, Oklahoma 74020 (U.S.A.)
Manuscript online since February 28, 2014
[Editor: Bruno ]
![]()
Timing and rates of tectonic events, evolutionary processes, and oceanographic and paleoclimatic changes must be based on high-precision numerical age calibration of stages defined in Global Stratotype and Section Points (GSSPs). The Cretaceous Chronostratigraphic Database (CRETCSDB3) is an objective, testable database that calibrates select Cretaceous events and enables high-resolution chronostratigraphic correlations.
CRETCSDB3 is a compilation of more than 3500 taxa and marker beds in nearly 300 published sections calibrated to a mega-annum (Ma) scale. The database spans the Jurassic/Cretaceous and the Cretaceous/Paleogene boundaries. Construction of CRETCSDB3 began by plotting bioevents in the Kalaat Senan, Tunisia, Cenomanian-Turonian section to the 1989 time scale. The sedimentology, sequence stratigraphy, and biostratigraphy of this section were precisely documented and stage boundaries defined biostratigraphically. Additional sections with radiometrically dated beds were graphed to constrain the accuracy of the numerical scale. Ranges of first and last occurrences are calibrated to mega-annums of Cretaceous stages defined by GSSPs or reference sections. This database serves as a look-up table for interpolation and age calibration of other stratigraphic sections. The age ranges of some taxa and marker beds are preliminary and may be extended as new sections are added to the database.
CRETCSDB3 tested the numeric age calibration of the Albian/Cenomanian boundary. This boundary in North Texas accurately correlates with the GSSP in France by ammonites, planktic foraminifers and dinoflagellates. This stage boundary in North Texas correlates with the 97.88±0.69 Ma Clay Spur Bentonite in Wyoming by sequence stratigraphy and cosmopolitan dinoflagellates. The inconsistency between this age and the current 100.5 Ma date of the 2012 Geologic Time Scale remains to be evaluated independently.
Cretaceous; chronostratigraphy; biostratigraphic database; numerical age scaling
R.W. (2014).- A Cretaceous chronostratigraphic database: construction and applications.- Carnets de Géologie [Notebooks on Geology], Brest, vol. 14, nº 2, p. 15-37.
Une base de donnÈes chronostratigraphiques pour le CrÈtacÈ : construction et applications.- La chronologie et la frÈquence des ÈvËnements tectonique, des processus de l'Èvolution, des perturbations palÈoocÈanographiques et des changements palÈoclimatiques doivent Ítre basÈes sur un Ètalonnage ý haute-rÈsolution des ‚ges numÈriques pour les Ètages tels qu'ils sont dÈfinis aujourd'hui par des Points Stratotypiques Mondiaux (traduction franÁaise de "Global Stratotype and Section Point, GSSP"). Cette base de donnÈes chronostratigraphiques pour le CrÈtacÈ (baptisÈe CRETCSDB3) organise des informations objectives et vÈrifiables afin d'Ètalonner certains ÈvËnements crÈtacÈs et de permettre des corrÈlations chronostratigraphiques ý haute-rÈsolution.
CRETCSDB3 rÈunit une documentation rÈpertoriant plus de 3500 taxons et couches repËres provenant de quelque 300 sections ayant fait l'objet de publications et ÈtalonnÈes sur une Èchelle en millions d'annÈes (Ma). Elle couvre les limites Jurassique-CrÈtacÈ et CrÈtacÈ-PalÈogËne. La construction de CRETCSDB3 a dÈbutÈ avec la projection des bioÈvÈnements de la coupe du CÈnomanien-Turonien de Kalaat Senan en Tunisie sur un diagramme utilisant l'Èchelle des temps gÈologiques de 1989. La sÈdimentologie, le dÈcoupage stratigraphique sÈquentiel et la biostratigraphie de cette coupe ont ÈtÈ prÈcisÈment documentÈs et les limites d'Ètages y ont ÈtÈ dÈfinies biostratigraphiquement. Des coupes complÈmentaires avec des couches datÈes radiomÈtriquement ont Ègalement ÈtÈ reportÈes de maniËre graphique afin d'amÈliorer la fiabilitÈ des ‚ges numÈriques. Les intervalles de premiËre et de derniËre occurrences ont ÈtÈ ÈtalonnÈs aux millions d'annÈes des Ètages crÈtacÈs dÈfinis par des Points Stratotypiques Mondiaux ou des coupes de rÈfÈrence. Cette base de donnÈes est utilisÈe comme tableau de rÈfÈrence pour interpoler et Ètalonner les ‚ges des autres coupes stratigraphiques. Les intervalles de temps de quelques taxons et couches repËres sont provisoires et devraient Ítre rÈvisÈs au fur et ý mesure que de nouvelles coupes seront intÈgrÈes ý la base de donnÈes.
CRETCSDB3 a contrÙlÈ l'Ètalonnage de l'‚ge numÈrique de la limite Albien - CÈnomanien. Cette limite dans le Nord Texas est trËs prÈcisÈment corrÈlÈe avec le Point Stratotypique Mondial en France par le biais des ammonites, des foraminifËres planctoniques et des dinoflagellÈs. Dans le Nord Texas cette limite d'Ètage peut Ègalement Ítre corrÈlÈe par le biais de la stratigraphie sÈquentielle et de dinoflagellÈs cosmopolites avec une bentonite de Clay Spur au Wyoming datÈe de 97.88±0.69 Ma. L'incohÈrence entre cet ‚ge et celui de 100.5 Ma figurant sur l'Èchelle des temps gÈologiques de 2012 reste ý Èvaluer de faÁon indÈpendante.
CrÈtacÈ ; chronostratigraphie ; base de donnÈes biostratigraphiques ; Ètalonnage d'‚ges numÈriques
The numerical age calibration of the Phanerozoic chronostratigraphic scale has progressed to a stage where the ages of erathems and systems are stabilizing. Compare the 1989 geologic time scale ( et al., 1990) and the 1994 scale (, 1994) with the Geologic Time Scale 2004 (GTS2004, et al., 2004) and with the most recent Chronostratigraphic Chart (GST2012, et al., 2012). None the less, age calibration of stages is continuously evolving as new data and new methodologies emerge. GTS2004 was formed using ten methods: 1) rates of radioactive decay of elements, 2) tuning to orbital time scales, 3) stratigraphic reasoning, 4) biostratigraphic/ geomagnetic calibrations, 5) equal durations of zones to scale stages, 6) zone duration proportional to zone thickness, 7) constancy of ocean floor spreading rates, 8) trends in strontium isotope scales, 9) geomathematical/statistical interpolations, and 10) best-fit line of age dates versus stratigraphic assignments (, 2004). Although many more isotopic ages have been measured during the past twenty-three years and their precision has improved, as yet, numerical ages of most system boundaries have not been measured because suitable beds are not available at the boundaries. Furthermore, the ages of some stage boundaries are inconsistent even where radiometrically dated strata are interbedded with biostratigraphic zones and sequence boundaries. For example the interpolated age of the Lower/Upper Cretaceous series boundary as defined by the Albian/Cenomanian stage boundary varies from 97.13 Ma to 100.5 Ma ( et al., 2002; et al., 2009; & , 2012: p. 1052, K25).
An important practical goal of stratigraphers is to determine the order of bioevents and to scale the events in numerical ages. The result would be 'look-up' tables of numeric ages of bioevents in the Phanerozoic time scale. These tables would enable geoscientists to calculate rates and durations of stratigraphic units and geologic processes operating between events. The process of compiling such tables must be based on a comprehensive database of measured sections and cores in which the species have been identified and placed in an accurate order measured in thickness. The scientific process of calibrating and scaling species ranges from thickness units to numeric time units must be transparent and testable.
As the accuracy of the chronostratigraphic scale improves and stabilizes, chronostratigraphers are applying numeric ages to fossil zones and to first occurrence (FO) and last occurrence (LO) of many species. The use of FO/LO implies that these datums are observable and testable and that they may change as new data accrues (the FO/LO notation is preferred over first and last appearance datums - FAD/LAD, which imply that these datums are accurate evolutionary events). In GTS2004/2012 the FO and LO of select species are projected into the accompanying time scale. Specialists of specific taxonomic groups have published range charts calibrated to numeric time scales, for example Cretaceous planktic foraminifera ( et al., 1998; & , 2002). However the methodology of such age calibrations is not usually clear and not testable. Numerical methods for interpolating ages, such as spline curve fitting, use stratigraphic records of apparently continuous deposition and uniform rates of sediment accumulation. Subtle changes in rates and brief hiatuses or condensed sections may be overlooked and not accounted.
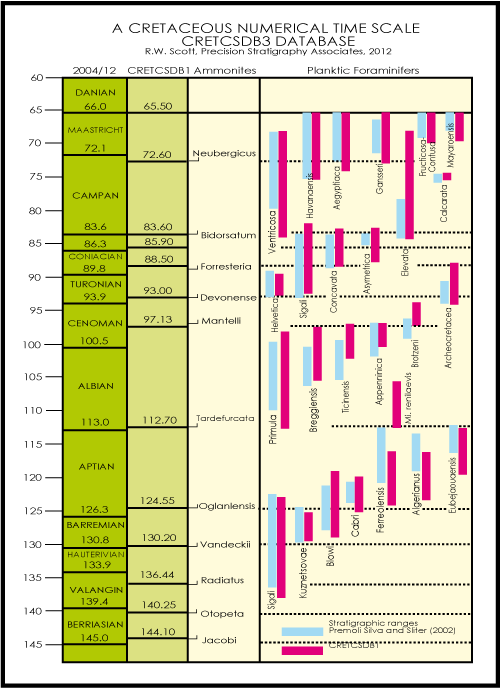
The ages of Cretaceous stage boundaries have evolved since 1989 and now the ages of several stage boundaries are
stabilizing, such as Maastrichtian/Paleogene, Santonian/Campanian, Coniacian/Santonian, Cenomanian/Turonian, Aptian/Albian, and the Tithonian/Berriasian
(Fig. 1 ![]() ). However the ages of these boundaries may change when global section and stratal points (GSSP) are defined for stage
boundaries. As of 2012 the base of three Cretaceous stages are defined by GSSPs: Cenomanian, Turonian, and Maastrichtian. The numerical ages of five stages continue to vary in light of new sample data, and existing ages are revised by new conversion factors and new
methodologies: Campanian/Maastrichtian, Turonian/Coniacian, Albian/Cenomanian, Valanginian/Hauterivian, and Berriasian/Valanginian. The uncertainty is partly the result of the paucity of radiometrically datable beds in these
intervals.
). However the ages of these boundaries may change when global section and stratal points (GSSP) are defined for stage
boundaries. As of 2012 the base of three Cretaceous stages are defined by GSSPs: Cenomanian, Turonian, and Maastrichtian. The numerical ages of five stages continue to vary in light of new sample data, and existing ages are revised by new conversion factors and new
methodologies: Campanian/Maastrichtian, Turonian/Coniacian, Albian/Cenomanian, Valanginian/Hauterivian, and Berriasian/Valanginian. The uncertainty is partly the result of the paucity of radiometrically datable beds in these
intervals.
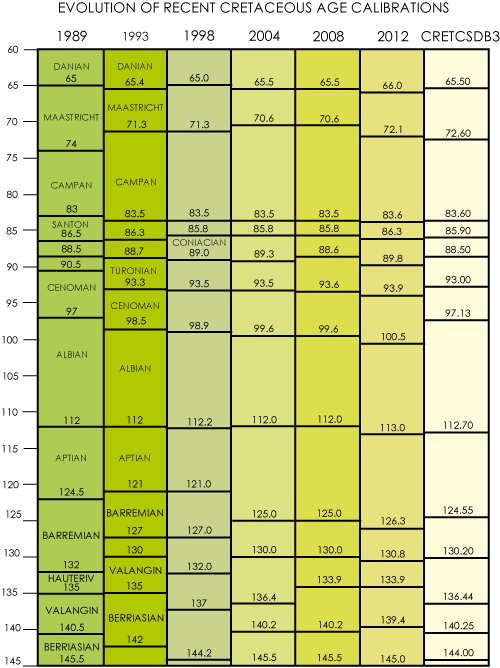
Click on thumbnail to enlarge the image.
Figure 1: Evolution recent of Cretaceous time scales in mega-annums (Ma). Sources: 1989 - et al., 1990; 1993 - , 1993; 1998 - et al., 1998; 2004 - et al., 2004; 2008 - et al., 2008; and GST 2012 - et al., 2012. These are compared to the CRETCSDB3 prepared by precisionstratigraphy.com as of October 2013.
The Cretaceous Chronostratigraphic Database -CRETCSDB3- was constructed by graphic correlation, which is a transparent, testable method of choice to integrate diverse types of stratigraphic data. Graphic correlation is a quantitative, non-statistical, technique that proposes coeval relationships between two sections by comparing the ranges of event records in both sections ( & , 1995). A graph of any pair of sections is an X/Y plot of the FOs (first appearances) and LOs (last appearances) of taxa found in both sections. The interpreter places a line of correlation (LOC) through the tops and bases that are at their maximum range in both sections. This LOC is the most constrained hypothesis of synchroneity between the two sections and adjusts the ranges of the fewest bioevents. The LOC also accounts for hiatuses or faults at stratal discontinuities indicated by the lithostratigraphic record. The position of the LOC is defined by the equation for a regression line. Explanation and examples of the graphic technique are illustrated by & (1995). A species range database is compiled by iteratively graphing successive measured sections or cores and integrating ranges in all sections. The accuracy of these ranges depends on the number of sections, preservation and correct identification of the species. The X/Y cross plot presentation appears to be similar to two-dimensional age/depth plots used by many stratigraphers, however, those plots use pre-determined age models that cannot be tested. In contrast event orders and ages compiled by graphic correlation can be fully evaluated because the sources of the data are available. In addition the order of events in different basins can be compared.
The measured sections of events are plotted to a standard section scaled in mega-annums. By iteratively plotting successive sections the ranges are composited in a numerical time scale. Such a database is testable and the process is transparent so that the fossil occurrence in each section can be evaluated to determine its accuracy. This process integrates data from numerous global sections analyzed by specialists. The database is documented by a series of seven appendices accessible through the 'CRETCSDB' link at http://precisionstratigraphy.com/.
The graphic correlation process retains the interpretation in the hands of a team of specialists rather than a heuristic computer program. This method enables the stratigrapher to detect hiatuses or changes in rates of sediment accumulation that might have been overlooked in assigning zones to the section. The objections to graphic correlation methodology posed by et al. (2004) can be eliminated by selecting a geologic time scale as the standard reference section (SRS). Thus the scale is in mega-annums rather than thickness and assumptions about sediment accumulation rates are avoided. The process is not limited to a few sections or a few stratigraphic events.
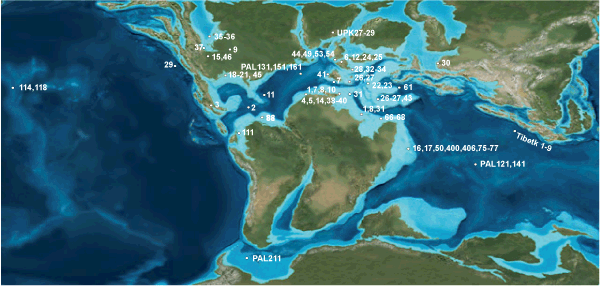
Construction of the Cretaceous Chronostratigraphic Data Base3 (CRECSDB3) began in late 1994 as an outgrowth of a joint project with the Free University of Amsterdam. This data base has become an integrated set of more than 3500 taxa,
magnetochrons, geochemical events, sequence stratigraphic, and other types of marker beds measured in more than 295 stratigraphic sections distributed from the Tethyan Realm to the Arctic and Antarctic
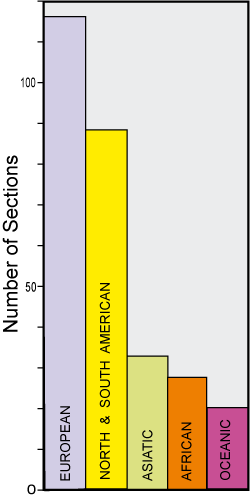
(Fig. 2 ![]() ). A majority of sections is from Europe and North America because these areas have been studied most
intensively; however all major continents and ocean basins are represented
(Fig. 3
). A majority of sections is from Europe and North America because these areas have been studied most
intensively; however all major continents and ocean basins are represented
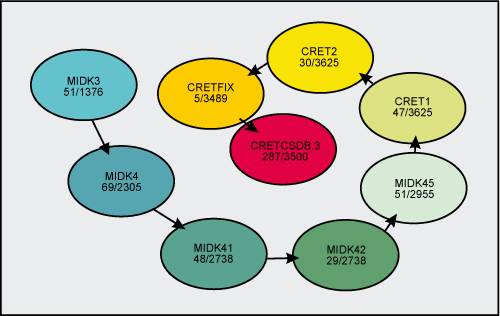
(Fig. 3 ![]() ). These chronostratigraphic events were integrated relative to each other by progressive sets of graphic correlation
experiments. Building successive sets of 40 to 60 sections was necessary because of the limits of the GraphCor software. An unlimited number of sections can be analyzed in subsequent
projects, thereby overcoming the perceived disadvantage that the number of sections is limited ( et al.,
2004). The CRETCSDB3 was compiled in eight graphic correlation
projects: MIDK3, MIDK4, MIDK41, MIDK42, MIDK45, LOK, CRET1, and CRET2
(Fig. 4
). These chronostratigraphic events were integrated relative to each other by progressive sets of graphic correlation
experiments. Building successive sets of 40 to 60 sections was necessary because of the limits of the GraphCor software. An unlimited number of sections can be analyzed in subsequent
projects, thereby overcoming the perceived disadvantage that the number of sections is limited ( et al.,
2004). The CRETCSDB3 was compiled in eight graphic correlation
projects: MIDK3, MIDK4, MIDK41, MIDK42, MIDK45, LOK, CRET1, and CRET2
(Fig. 4 ![]() ).
).
Click on thumbnail to enlarge the image.
Figure 2: Map of selected MIDK and other database sections showing geographic distribution of section data (with file numbers) in CRETCSDB3 plotted on an Early Cretaceous paleogeographic map (, 2010; © Ron , Colorado Plateau Geosystems).
Click on thumbnail to enlarge the image.
Figure 3: Histogram of geographic distribution of sections in CRETCSDB3.
Click on thumbnail to enlarge the image.
Figure 4: Process model showing successive project stages and the number of sections and cumulative number of events in CRETCSDB3.
The first project, MIDK3.CAT, was designed to use a time scale as the standard reference section (SRS) so that no assumption was made as to constancy of rates of sediment accumulation. The succession of section graphs then were scaled to time units rather than thickness units. The first experiment used the 1990 Geologic Time Scale (1989) as the SRS plotted to the Kalaat Senan, Tunisia Cenomanian/Turonian section ( et al., 1990). The MIDK3 project is composed of 51 outcrop and cored Aptian to Coniacian sections from the Crimea to the North American Western Interior Basin. The Albian/Cenomanian GSSP section at Mont Risou near Rosans, France defines this boundary in the project. The ranges of chronostratigraphic events were saved in the MIDK3CS.1 file, which was then used as the SRS for the next project. At the end of each project the data was saved in a similar and growing data file, which was then used to compile the next project.
The second project, MIDK4, was designed to test processes of Aptian to Campanian carbonate shelves and Upper Cretaceous oceanic redbeds (CORBs) (, 2009). The standard reference section is the MIDK3CS.1, which is the composite of all sections in MIDK3.cat. MIDK4 is composed of 67 sections between Tibet on the east and westward to North America and includes critical DSDP Atlantic, Indian Ocean and Weddell Sea cored sections. In this project the base of the Aptian Stage is defined by ammonites in Georgian sections, formerly of the USSR (BAPTCS.1). The Turonian/Coniacian reference sections in northwestern Germany compose the WOODCS.1 section. The Cretaceous/Paleogene boundary was cored in ODP 1050C on the Blake Nose in the Western Atlantic (MIDKPAL.35).
The third project was MIDK41, which integrated all the data in MIDK4 with the revised ages of stage boundaries ( et al., 2004), which is the reference section (NEWKAGES.1). An additional 45 sections were integrated with this time scale. Several key Cenomanian/Turonian sections already in the database were re-graphed in order to re-set the ages of FOs to 93.00 Ma. However the LOs did not change. Additional sections in carbonate shelves and in the Upper Cretaceous redbed sections were added. These data were saved as MIDK41CS.1, which became the SRS of the fourth project, MIDK42. In this project the age of the Cenomanian-Turonian boundary was revised by graphing sections spanning Cenomanian-Turonian boundary. New sections from the Sinai and Tibet were added to extend the control of the Late Cretaceous interval and saved as the composed section MIDK42CS.1.
The fifth project, MIDK45, used MIDK42CS.1 as the SRS and added 44 Upper Cretaceous shelf and basin sections in Turkey, Spain, Croatia, France, Sinai, Iran, and palynological data from Greenland. The Angles section in Southern France was included to add data across the Barremian/Aptian boundary. The resulting MIDK45CS.1 data set is the SRS for CRET1, which was the next step that extended the database down to the Jurassic/Cretaceous boundary. In order to constrain Lower Cretaceous ammonite and calpionellid zones a separate project, LOKCS.2, was created and was integrated with CRET. LOKCS.2 consists of twenty-three sections that integrate ammonites, nannoplankton and magnetochrons and spans the Berriasian through Barremian stages and into the lower part of the Aptian. The Olazagutia, Spanish section spanning the Coniacian-Campanian was also added to CRET1. This database was extended to include key Upper Cretaceous sections and their ammonite zones in the Western Interior.
This database was then graphed to the MIDK45CS.1 database derived from project MIDK45 to form the CRET1.CAT project. The standard reference section of CRET1 was the 2004 Geologic Time Scale (GTS2004, et al., 2004). Only the numerical age of the Albian/Cenomanian boundary differs significantly from the GTS2004 age because it was calibrated to Western Interior bentonites that correlate to the North Texas section by dinoflagellates and sequence stratigraphy (, 2007; et al., 2007, 2008). In the North Texas section ammonites constrain the base Cenomanian ( et al., 2005). The CRET1 project is composed of 40 sections, many of which are of Upper Cretaceous siliciclastic sections in the Western Interior.
The numerical ages of latest Cenomanian to earliest Turonian LOs were re-calibrated to the revised age of the Cenomanian/Turonian boundary ( et al., 2004; & , 2012) by re-graphing 26 key sections spanning this boundary to comprise CRET2.CAT. Also included were selected sections that increased the occurrences of key bioevents. The MOWRYCS database of 19 Western Interior sections was also added to integrate the middle Cretaceous siliciclastic Dakota Group and Mowry Shale sections in New Mexico, Colorado, Wyoming, and Montana, which included the important bentonites used previously to date the Albian/Cenomanian boundary (, 1993; et al., 1999; et al., 2008; et al., 2009).
The final step in compiling CRETCSDB3 was to re-set the LOs across the Cenomanian/Turonian
boundary. These occurrences were deleted in CRET2CS.1, which then was graphed to GTS 2004 as CRETFIX.CAT project. This file, CRETCS3.1 was graphed to NEWKAGES.1 and CRET.1 in the CRETFIX.CAT. This composited dataset was saved as CRETCSDB3
(Fig. 5 ![]() ).
).
Click on thumbnail to enlarge the image.
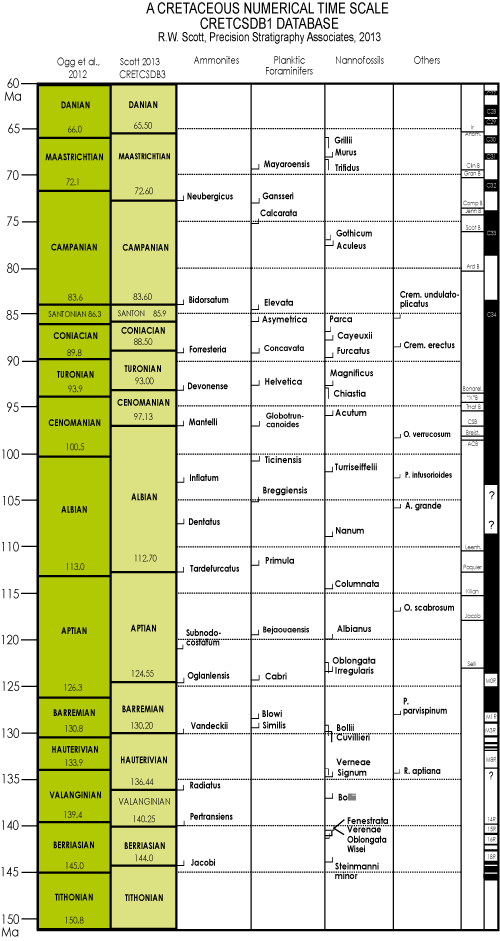
Figure 5: A Cretaceous time scale with numerical ages as calibrated in GTS2012 and in CRETCSDB3. First and last appearance biodatums and magnetochrons calibrated to stages and numerical ages in CRETCSDB3. Middle Cretaceous magnetochrons not yet well defined in reference sections are not included.
The Cretaceous geochronologic scale is constrained by numerous radiometric measurements
(Table 1 ![]() ). The majority of ages were determined on sanidine by 40Ar/39Ar from Albian through Maastrichtian bentonites in North America (,
1993; et al.,
1998; et al., 1999; & ,
2007).
High-precision glauconite dates have also been used to scale the Cretaceous (,
1994). Many of the dates have been updated by other workers in GTS2012 and new analyses are in progress (B. , personal communication, 2013). The numerical ages derived by radiometric analyses continuously evolve as new standards and methods are used.
(1993) measured sanidine ages from beds at diverse localities associated with actual or inferred key fossils that represent the zones. Only those ages in measured sections were graphed into CRETCSDB3. Many other ages were from isolated beds associated with zonal fossils and were interpolated to calibrate the scaling of the Western Interior ammonite zones ( et al.,
2006). In the Red Bird section, eastern Wyoming, six bentonite beds are interbedded with fossil zones dated by
(1993); these beds were graphed into the CRETCSDB3. Other dated strata are in well documented biostratigraphic sections and have been integrated into CRETCSDB3. An additional age of 115.5±0.7 Ma from a tuff bed in northern Mexico was derived from U/Pb in zircon ( et al.,
2005), however no comparable date is in GTS2012. This bed is a few meters below the Upper Aptian Immunitoceras immunitum Assemblage Zone, which consists of Eodouvilleiceras adkinsi, Hypacanthoplites ceratitosus, and Parahoplites fasciculatus ( et al.,
2008). Zircon in rhyolites overlying the Upper Valanginian Calcicalathina oblongatañSpeetonia colligata assemblage (NK-3) in Tibet are dated at 136.0±3.0 Ma by the SHRIMP method ( et al.,
2011). The Berriasian-Valanginian Assipetra infracretacea Subzone of the Retecapsa
[Cretarhabdus] angustiforata Zone (NK-2) is dated at 138.46±0.29 (GTS2012). However these two radiometrically dated strata are not in the same bed as these taxa so they are compared with the ages of the FO of the species in CRETCSDB3, which are somewhat older.
). The majority of ages were determined on sanidine by 40Ar/39Ar from Albian through Maastrichtian bentonites in North America (,
1993; et al.,
1998; et al., 1999; & ,
2007).
High-precision glauconite dates have also been used to scale the Cretaceous (,
1994). Many of the dates have been updated by other workers in GTS2012 and new analyses are in progress (B. , personal communication, 2013). The numerical ages derived by radiometric analyses continuously evolve as new standards and methods are used.
(1993) measured sanidine ages from beds at diverse localities associated with actual or inferred key fossils that represent the zones. Only those ages in measured sections were graphed into CRETCSDB3. Many other ages were from isolated beds associated with zonal fossils and were interpolated to calibrate the scaling of the Western Interior ammonite zones ( et al.,
2006). In the Red Bird section, eastern Wyoming, six bentonite beds are interbedded with fossil zones dated by
(1993); these beds were graphed into the CRETCSDB3. Other dated strata are in well documented biostratigraphic sections and have been integrated into CRETCSDB3. An additional age of 115.5±0.7 Ma from a tuff bed in northern Mexico was derived from U/Pb in zircon ( et al.,
2005), however no comparable date is in GTS2012. This bed is a few meters below the Upper Aptian Immunitoceras immunitum Assemblage Zone, which consists of Eodouvilleiceras adkinsi, Hypacanthoplites ceratitosus, and Parahoplites fasciculatus ( et al.,
2008). Zircon in rhyolites overlying the Upper Valanginian Calcicalathina oblongatañSpeetonia colligata assemblage (NK-3) in Tibet are dated at 136.0±3.0 Ma by the SHRIMP method ( et al.,
2011). The Berriasian-Valanginian Assipetra infracretacea Subzone of the Retecapsa
[Cretarhabdus] angustiforata Zone (NK-2) is dated at 138.46±0.29 (GTS2012). However these two radiometrically dated strata are not in the same bed as these taxa so they are compared with the ages of the FO of the species in CRETCSDB3, which are somewhat older.
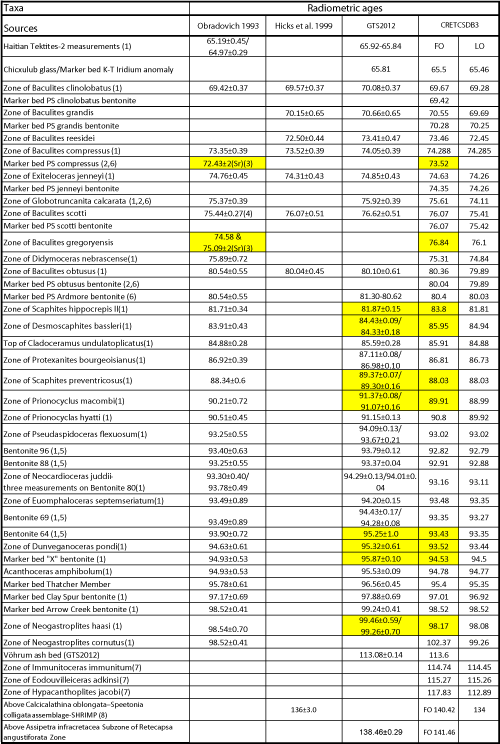
The majority of radiometric ages are within one million years of numerical ages in CRETCSDB3; those ages that differ by more than 1 myr are highlighted
(Table 1 ![]() ). The original ages of some beds are closer to the CRETCSDB3 ages; however the greatest difference results from the different calibration of the Cenomanian/Turonian boundary, which was re-calibrated since the beginning of the Cretaceous dataset. Also ages spanning the Albian/Cenomanian boundary differ because two different radiometric age calibrations are used to constrain this boundary (see discussion in section on stage calibrations).
). The original ages of some beds are closer to the CRETCSDB3 ages; however the greatest difference results from the different calibration of the Cenomanian/Turonian boundary, which was re-calibrated since the beginning of the Cretaceous dataset. Also ages spanning the Albian/Cenomanian boundary differ because two different radiometric age calibrations are used to constrain this boundary (see discussion in section on stage calibrations).
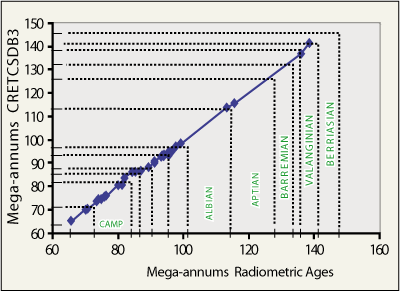
An X/Y plot visually compares the radiometric ages with ages interpolated by graphing of well documented sections in CRETCSDB3
(Fig. 6 ![]() ). This plot demonstrates that the two methods produce precise time scales that are consistent where stage ages are consistent. Ages of Santonian ammonites are an outlier set on the correlation line. The ages of FOs of Scaphites hippocrepis II and Desmoscaphites bassleri are different in CRETCSDB3 than in GTS2012. These discrepancies suggest that the range of S. hippocrepis II was dated near its extinction point rather than at its FO, and that D. bassleri ranges below the dated bed in another section of CRETCSDB3. Ages in the older part of the Cretaceous Period are not well constrained stratigraphically so that the comparison is inaccurate.
). This plot demonstrates that the two methods produce precise time scales that are consistent where stage ages are consistent. Ages of Santonian ammonites are an outlier set on the correlation line. The ages of FOs of Scaphites hippocrepis II and Desmoscaphites bassleri are different in CRETCSDB3 than in GTS2012. These discrepancies suggest that the range of S. hippocrepis II was dated near its extinction point rather than at its FO, and that D. bassleri ranges below the dated bed in another section of CRETCSDB3. Ages in the older part of the Cretaceous Period are not well constrained stratigraphically so that the comparison is inaccurate.
Another outlier is around the Cenomanian/Turonian boundary. Numerous closely spaced, radiometrically dated bentonite beds are interbedded with key zone taxa. Even though the dated beds and fossils were not collected from a single measured section, the beds and zones are in a consistent stratigraphic order. The bioevents crossing this boundary are younger in CRETCSDB3 than in GTS2012 because ranges in CRETCSDB3 were reset from the 1990 90.5 Ma age to 93.0 Ma to accommodate the 1993-1998 revised Cretaceous time scale. Because the numeric age of this boundary varies (B. , personal communication, 2013), the ages in CRETCSDB3 must be re-calibrated.
Click on thumbnail to enlarge the image.
Figure 6: Plot of published Cretaceous radiometric 40Ar/39Ar ages of key strata with numerical ages integrated by graphic methods in CRETCSDB3.
Click on thumbnail to enlarge the image.
Table 1: Comparison of published numerical ages of Cretaceous ammonite zones and marker beds interpolated in GTS2012 compared with numerical ages of same events in CRETCSDB3. Yellow fill notes ages out of predicted order. (1) , 1993; 40Ar/39Ar Sanidine, Tables I, II; in section data NEWKAGES.1; (2) Revised by et al., 1999; (3) & , 2007; (4) et al., 1998; (5) et al., 2000b; Beds in Pueblo, Colorado Cenomanian/Turonian outcrop in sections MIDK.15B, NEWKAGES.1; (6) By graph of UPK.19; (7) et al., 2008; (8) et al., 2011.
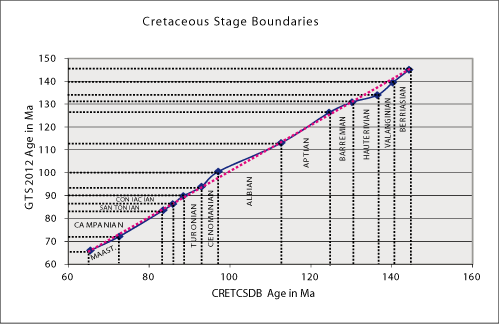
The GSSP sections of the Cenomanian, Turonian and Maastrichtian are incorporated into CRETCSDB3, and boundaries of other stages in CRETCSDB3 are defined by the same criteria as used in GTS2012. The numerical age calibration of Cretaceous stage boundaries in both GTS2012 and CRETCSDB3 track closely except the Albian/Cenomanian and the Valanginian/Hauterivian boundaries
(Fig. 7 ![]() ). The age of the Cenomanian base varies in the two databases because different sections and different radiometrically dated beds are used to constrain the age and because cyclostratigraphic data of the Albian and Cenomanian are incorporated in both stage scales ( et al.,
2001;
et al., 2002; et al.,
2004; et al.,
2009).
). The age of the Cenomanian base varies in the two databases because different sections and different radiometrically dated beds are used to constrain the age and because cyclostratigraphic data of the Albian and Cenomanian are incorporated in both stage scales ( et al.,
2001;
et al., 2002; et al.,
2004; et al.,
2009).
Click on thumbnail to enlarge the image.
Figure 7: Plot of numerical ages of stage boundaries in GST2012 with those in CRETCSDB3.
The base of the Cretaceous System in GTS2012 currently is placed at the base of the Berriasian Stage although no GSSP has been designated ( et al., 2004; & , 2012). Criteria used in construction of GTS2004/2012 are the FO of Berriasella jacobi and the base of Calpionellid Zone B defined by the FO of the intermediate spherical form of Calpionella alpina, both of which are within the upper part of Chron M19n. These criteria are located in sections in southeastern France and at Rio Argos, Spain.
In CRETCSDB3 the Rio Argos section (LOK.2), one of the first datasets used to construct the Lower Cretaceous range data, sets the FO of B. jacobi at 10 m, but neither magnetochrons or Calpionellid Zone B were identified in this section. However all three criteria are reported in the Puerto Escano section, Southern Spain (LOK.28); the magnetochron and C. alpina also co-occur in the Italian Bosso Valley section (LOK.8); the magnetochron is recorded with nannoplankton also in the Fiume Bosso Section, Italy (LOK.26) and the Fonte Giordano Section (LOK.27).
The numerical age calibration of the base of the Berriasian has had a wide error bar because no direct calibration points are available; the age used in GTS2004 was 145.5±4.0 Ma and in GTS2012 it is 145.0±0.8 Ma. This age was derived from the M-sequence magnetic polarity time scale ( & , 2004). The interpolated age of the Berriasian base in CRETCSDB3 is 144.30 Ma at the FO of B. jacobi; the age span of Chron M19n is 143.96-143.79 Ma and the age range of Calpionella alpina is 145.47 to 138.85 Ma. Additional suitable sections have yet to be documented in which all three criteria occur together.
The base of the Valanginian Stage is placed at the bases of Chron M14r.3 and Calpionellid Zone E defined by the FO of Calpionellites darderi in GTS2004/2012. These events are slightly below the FO of Tirnovella [Thurmanniceras] pertransiens and Thurmanniceras otopeta. A possible GSSP section is the Barranco de CaÒada Luenga section in southeastern Spain, where two short sections have been documented ( et al., 2000) (LOK.31, LOK.32 in CRETCSDB3). Both T. pertransiens and C. darderi first occur together in both sections; one taxon is slightly below the top of Chron M15r in one section and the other is just above the top in the other section. The age of T. pertransiens in CRETCSDB3 is 139.43 Ma, T. otopeta is 140.26 Ma, and C. darderi is 141.80 Ma; the top of M14r is 140.71 Ma and the top of M14n is 140.69 Ma. In GTS2004 the age of the Valanginian base is 140.2±3.0 Ma and in GTS2012 it is 139.4 Ma.
The base of the Hauterivian Stage is at the base of Chron M10n and close to the FO of Acanthodiscus radiatus, which is dated at 136.4±2.0 Ma in GST2004 and at 133.9 Ma in GTS2012. The key reference section for the Hauterivian is the section near La Charce in southeastern France (section LOK.13 in CRETCSDB3). The FO of A. radiatus is dated at 134.28 Ma in CRETCSDB3. The age of this boundary is constrained by a new radiometric date of 136.0±3.0 Ma overlying Valanginian nannofossils in Tibet ( et al., 2011).
The Barremian Stage is defined by the FO of Taveraidiscus hughii [formerly "Spitidiscus" hughii] and Avramidiscus vandeckii in GTS2004, which is dated at 130.0±1.5 Ma and at 130.8 Ma in GTS2012. The proposed stratotype is the Rio Argos section, Caravaca, Spain (section LOK.3 in CRETCSDB3). The FO of "Spitidiscus" hugii is projected at 128.00 Ma in CRETCSDB3 and of FO Avramidiscus [Spitidiscus] vandeckii at 130.23 Ma; these bioevents are in the upper part Chron M5r, the top of which is dated at 130.78 Ma in CRETCSDB3.
The base of the Aptian Stage is proposed to be Chron M0r in the pelagic succession at Gorgo a Cebara, Italy, which is dated at 125.0±1.0 Ma in GTS2004 and 126.3 Ma in GTS2012. In CRETCSDB3 Chron M0r is dated at 125.0 Ma in this section (MIDK.43). Two ammonites first appear slightly younger: FO Deshayesites oglanlensis at 124.55 and Deshayesites tuarkyricus at 124.44 Ma. In Boreal sections the alternative bioevent is the FO of Prodeshayesites spp., which is represented by P. obsoletus in CRETCSDB3 dated at 125.22 Ma.
The definition of the base of the Albian Stage is as yet undecided ( et al., 2004) but the Italian Monte Petrano section (MIDK.55) is a candidate GSSP ( et al., 2000a). The FO of Leymeriella tardefurcata is the proposed basal criterion and is close to the Niveau bed and a carbon isotope marker, which are dated at 112.0±1.0 Ma by GTS2004. Slightly older is the FO of the nannofossil Prediscosphaera columnata. These four event markers occur together in the Mt. Petrano section and are dated in CRETCSDB3 at 112.68 Ma, 112.72 Ma, and 114.53 Ma, respectively. However in GTS2012 the Albian base is tentatively placed at the FO of Leymeriella schrammeni and dated at 113 Ma. This bioevent is documented in the infilled Vˆhrum 4 Quarry in northwestern Germany where L. schrammeni anterior is 0.1 m above the FO of Hypacanthoplites jacobi and 0.7 m below the FO of Prediscosphaera cf. columnata (circular form) ( et al., 2003). The FO of L. schrammeni schrammeni is 9.0 m higher. This section has been graphed with the CRETCSDB3 and the resulting numerical age of FO of L. schrammeni anterior is 113.51 Ma and the FO of L. schrammeni schrammeni is 112.96 Ma. The absence of an agreement of an event to mark the base of the Albian Stage impacts the accuracy and precision of cyclostratigraphic calibration of the Albian duration.
The base of the Cenomanian Stage is at the FO of Thalmanninella globotruncanoides in the GSSP at the Mont Risou section, southeastern France ( et al., 2004). The age calibration of this boundary has evolved considerably since 1993 when the age was pegged at 98.5±0.5 Ma (, 1993) to 99.6±0.9 in GST2004 and 100.5 Ma in GTS2012. An alternative data set of sequence stratigraphy, cosmopolitan dinoflagellate and ammonite events correlate the Albian/Cenomanian boundary in the U.S. Gulf Coast with the Clay Spur Bentonite Bed radiometrically dated at 97.88±0.69 Ma in the Western Interior ( et al., 2009; age revised in GTS2012). Because CRETCSDB data set was founded prior to the evolution of this age, the FO of T. globotruncanoides is projected at 97.13 Ma by correlation with the Clay Spur. This age calibration results in a 15.47 myr duration for the Albian Stage, which is considerably longer than the 11.6±0.2 myr duration projected by cyclostratigraphy ( et al., 2004; et al., 2006; et al., 2009). Calibration of the Albian duration by cyclostratigraphy is as yet uncertain because of differences in the eccentricity frequencies and the number of cycles counted in the Monte Petrano and Piobicco sections ( et al., 2009: Fig. 9).
In the Turonian Stage GSSP (MIDK.15) at Pueblo, Colorado, the FO of Watinoceras devonense is the criterion defining the stage ( et al., 2000b). The age is constrained at 93.5±0.8 Ma by numerous closely associated bentonite beds in GTS2004 and 93.9 Ma in GTS2012. In CRETCSDB3 the initial age was 90.5 Ma used by et al., (1990), which was the age scale used in the first step constructing the MIDK3 database in 1994, the precursor dataset of CRETCSDB3. Subsequently the age of this boundary was shifted to 93.00 Ma by re-graphing the Kalaat Senan section (MIDK.1), which brought the FOs down but the LOs did not move because their ages were set in the standard section. Subsequently this data set was edited in order to recalibrate the last occurrences to approximate the older age.
Although no GSSP has been accepted to define the base of the Coniacian Stage, the FO of Cremnoceras deformis erectus is the preferred marker in either the Slazgitter-Salder Quarry (Wood.1) in northern Germany or in the Pueblo section, Colorado (MIDK.15, MIDK.15B). Its age in GTS2004 was 89.3±1.0 Ma and more recently in GTS2012 the age was shifted to 89.8±0.3 Ma. GTS2012 uses the FO of Scaphites preventricosus as an equivalent stage base. In CRETCSDB3 the age of C. deformis erectus is 88.51 Ma, which was used in the 1989 time scale (1990) and the age of the FO of S. preventricosus is 88.03 Ma.
The Santonian Stage is defined by the FO of Cladoceramus undulatoplicatus in the quarry at Olazagutia, Spain (UPK.3), the proposed GSSP ( & , 2007). Its age was calibrated at 85.8±0.7 Ma in GTS2004, 85.8 Ma in GTS2008, and at 86.3±0.5Ma in GTS2012. In CRETCSDB3 this bioevent is documented in the Olazagutia quarry and dated at 85.91 Ma. This bioevent is documented in several other sections including Eastbourne, United Kingdom (MIDK.29), Austin, Texas (UPK.1), and Ten Mile Creek, Dallas, Texas (Coniac.3). However, GST2012 uses the FO of Clioscaphites saxitonianus, which is equated with the base of C. undulatoplicatus and dated at 86.26 Ma. In CRETCSDB3 the C. saxitonianus bioevent is dated at 85.89 Ma.
The base of the Campanian Stage was initially defined by the FO of Placenticeras bidorsatum, a rare species; recently the LO of the uncommon pelagic crinoid, Marsupites testudinarius, has been proposed to mark the Santonian/Campanian boundary ( et al., 2004). Two sections are candidate stratotypes, the English chalk section and the Waxahachie Dam Spillway, Texas (UPK.37). The base of the Campanian was dated at 83.5±0.7 Ma by GTS2004, GTS2008 and GTS2012. In CRETCSDB3 the base of the stage is dated at 83.55 Ma by the LO of M. testudinarius, which is slightly younger than the FO of P. bidorsatum at 83.57 Ma. GTS2012 places the FO of the Western Interior ammonite, Scaphites leei III, dated at 83.64 Ma at the base.
Following a long, complex history, the definition of the Maastrichtian Stage was set 90 cm below the FO of Pachydiscus neubergicus and Hoploscaphites constrictus in a quarry near Tercis les Bains in southwestern France (, 1996; & , 2001; et al., 2004; & , 2012). The age calibration of this boundary, however, is uncertain. One hypothesis correlates the GSSP horizon close to the base of the Western Interior ammonoid zone of Baculites jenseni and to the middle of Chron C32n.2n, both of which are interbedded with a bentonite dated at 72.4±0.5 Ma ( et al., 2004, p. 365). In CRETCSDB3 the B. jenseni bioevent is dated at 72.38 Ma and the magnetochron spans from 73.29 to 71.85 Ma; the FO of P. neubergicus is 72.58 Ma. However GTS2012 places the Western Interior Baculites baculus at the base and interpolates its age at 72.05 Ma; the age of this bioevent in CRETCSDB3 is 72.18 Ma.
The GSSP boundary of the Cretaceous Period and the Paleogene Epoch is the Iridium anomaly in the El Kef, Tunisia, section (UPK.5) (, 1999). This anomaly is also recorded in the southwest Atlantic (DSDP 516F, section PAL.131) and the Indian Ocean (ODP 752A+B, PAL.141). Top of the Maastrichtian in CRETCSDB3 is bracketed by the extinction of numerous key ammonites, foraminifera, nannoplankton, and dinoflagellates.
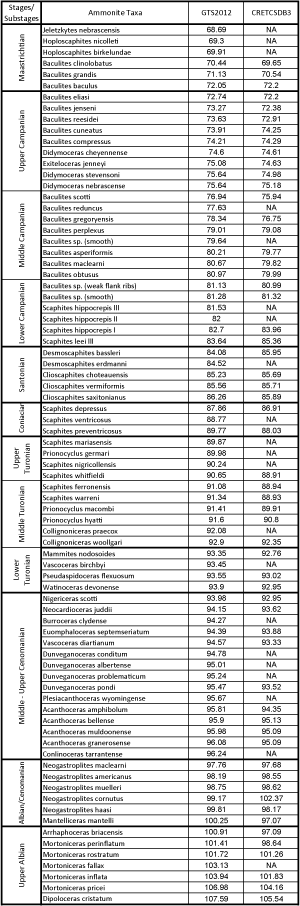
The GTS2012 chart lists 46 Upper Cretaceous Western Interior ammonite zones, most of which are in CRETCSDB3
(Table 2 ![]() ). The correlation of stage boundaries into the Western Interior are the interpretation of et al.
(2006). The ages of all but four Western Interior taxa are scaled in the predicted
order: Pseudaspidoceras flexuosum, Vascoceras diartianum, Neogastroplites cornutus and Neogastroplites haasi; three of these four are only slightly younger than adjacent zonal indices
(Table 2
). The correlation of stage boundaries into the Western Interior are the interpretation of et al.
(2006). The ages of all but four Western Interior taxa are scaled in the predicted
order: Pseudaspidoceras flexuosum, Vascoceras diartianum, Neogastroplites cornutus and Neogastroplites haasi; three of these four are only slightly younger than adjacent zonal indices
(Table 2 ![]() ). The stage assignment of the five Neogastroplites zones is
equivocal, being assigned to the Cenomanian because of the radiometric bentonite ages in GTS2012 and to the Upper Albian because of the regional correlations with the Texas section (,
2007; et al., 2009). The Upper Albian ammonite zones and subzones are included although they are not identified in the Western
Interior.
). The stage assignment of the five Neogastroplites zones is
equivocal, being assigned to the Cenomanian because of the radiometric bentonite ages in GTS2012 and to the Upper Albian because of the regional correlations with the Texas section (,
2007; et al., 2009). The Upper Albian ammonite zones and subzones are included although they are not identified in the Western
Interior.
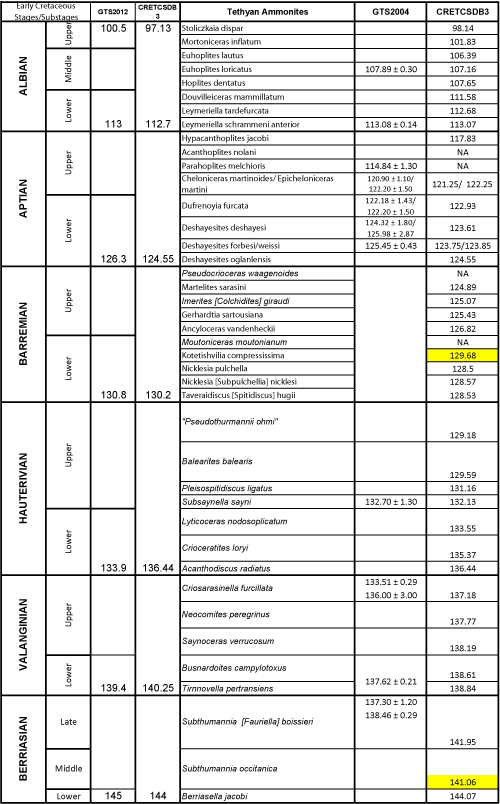
All but two of the Early Cretaceous zonal index species are documented in CRETCSDB3 and the ages of all but two are in the predicted order
(Table 3 ![]() ). The two zone index species that appear to be out of order are Early Barremian Kotetishvilia
[Subpulchellia] compressissima and Middle Berriasian Subthumannia occitanica. The FO of K. compressissima is calibrated at 129.68 Ma, which is older than the older three Barremian zones that are calibrated from 128.53 to 128.50 Ma
(Table 3
). The two zone index species that appear to be out of order are Early Barremian Kotetishvilia
[Subpulchellia] compressissima and Middle Berriasian Subthumannia occitanica. The FO of K. compressissima is calibrated at 129.68 Ma, which is older than the older three Barremian zones that are calibrated from 128.53 to 128.50 Ma
(Table 3 ![]() ). K. compressissima is reported in the Gorgo a Cerbara section, Italy (MIDK.43) in the interval of Magnetochron CM3R dated at 130.4-129.03 Ma, which spans from earliest Barremian to early Late Barremian (
& , 2012). This species is also recorded in the Campillo de Arenas section, southern Spain (MIDK.128) where it overlies the oldest Barremian zones of Nicklesia
[Subpulchellia] nicklesi and Taveraidiscus [Spitidiscus] hugii in the predicted
order; the age of the FO of K. compressissima is interpolated at 128.40 Ma. This discrepancy suggests that the ages of earliest Barremian events may need to be
re-calibrated. The Middle Berriasian Subthumannia occitanica is in the Rio Argos section, Spain (LOK.3) and the Berrias section, France (LOK.6) where its age is calibrated at 141.06 Ma. It overlies the 144.07 Ma Berriasella jacobi Zone and underlies the Subthumannia
[Faurella] boissieri Zone dated at 141.95 Ma.
). K. compressissima is reported in the Gorgo a Cerbara section, Italy (MIDK.43) in the interval of Magnetochron CM3R dated at 130.4-129.03 Ma, which spans from earliest Barremian to early Late Barremian (
& , 2012). This species is also recorded in the Campillo de Arenas section, southern Spain (MIDK.128) where it overlies the oldest Barremian zones of Nicklesia
[Subpulchellia] nicklesi and Taveraidiscus [Spitidiscus] hugii in the predicted
order; the age of the FO of K. compressissima is interpolated at 128.40 Ma. This discrepancy suggests that the ages of earliest Barremian events may need to be
re-calibrated. The Middle Berriasian Subthumannia occitanica is in the Rio Argos section, Spain (LOK.3) and the Berrias section, France (LOK.6) where its age is calibrated at 141.06 Ma. It overlies the 144.07 Ma Berriasella jacobi Zone and underlies the Subthumannia
[Faurella] boissieri Zone dated at 141.95 Ma.
Click on thumbnail to enlarge the image.
Table 2: Comparison of numerical ages of FO of Western Interior ammonite zones interpolated by et al. (2006) and numerical ages of Lower Cretaceous ammonite zones in GTS2014 with numerical ages in CRETCSDB3. Lower Cretaceous zonal scheme is mainly from et al. (2010).
Click on thumbnail to enlarge the image.
Table 3: Comparison of numerical ages of FO of Lower Cretaceous zones mainly from et al. (2010). Highlighted ages are discussed in text.
The ages of Cretaceous planktic foraminiferal zones and their ranges in CRETCSDB3 have been interpolated relative to older time scales ( et al.,
1998; & ,
2002). As the GTS2012 time scale evolves these ages must be
re-calibrated to revised ages of stage boundaries. The order of foraminiferal bioevents in CRETCSDB3 is the same as in these zone schemes
(Fig. 8 ![]() ) however some FOs are older in CRETCSDB3 than projected by and . Most differences are the result of different age calibrations of stage
boundaries.
) however some FOs are older in CRETCSDB3 than projected by and . Most differences are the result of different age calibrations of stage
boundaries.
Click on thumbnail to enlarge the image.
Figure 8: Comparison of planktic foraminiferal age models of GTS2012 (blue bars) and CRETCSDB3 (red bars).
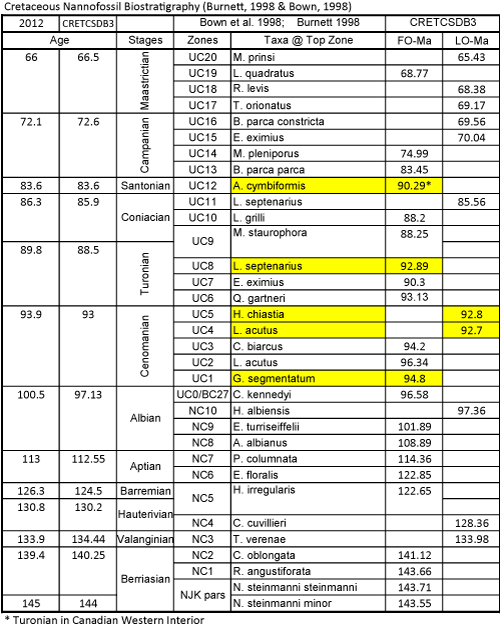
A revised Lower Cretaceous nannofossil zone scheme is based on new data from northwestern Europe, which integrated Boreal and Tethyan species with ammonite zones ( et al.,
1998). The Upper Cretaceous nannofossil biostratigraphy is composed of ranges in the North Sea integrated with Mediterranean and Indian Ocean data (,
1998)
(Table 4 ![]() ). The GTS2012 succession of nannofossil FO and LO are derived mainly from et al.
(1995) and et al.
(1998) with modifications from three other specialists (Table 5
). The GTS2012 succession of nannofossil FO and LO are derived mainly from et al.
(1995) and et al.
(1998) with modifications from three other specialists (Table 5 ![]() ).
).
The CRETCSDB3 database is composed of 430 nannofossil taxa including most of the taxa that define the various zonal
schemes. In order to evaluate the correspondence of the relative stratigraphic order of zone marker
species, the numerical ages in GTS2012 are plotted to the ages in CRETCSDB3
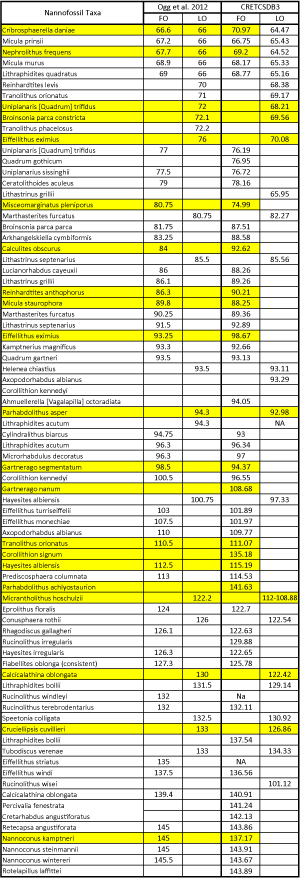
(Table 4 ![]() ). Most bioevent ages are consistent with the ages of the stages in which they are reported in GTS2012 ( et al.,
1992). However several events that mark stage boundaries in GTS2012 are younger in CRETCSDB3. The LO of Broinsonia parca constricta at the base
Maastrichtian is about 3 myr younger in the Maastrichtian. This species occurs above the top of magnetochron C32, which spans the
Campanian/Maastrichtian boundary in GTS2012. The FO of Arkhangelskiella cymbiformis marks the top of the Santonian and the UC12/UC13 boundary in GTS2012 however this species is reported in the Turonian in the Canadian Western Interior (et al., 1996). The base of the Cenomanian corresponds to the FO Corollithion kennedyi, which in CRETCSDB3 is scaled at 0.55 myr younger than the FO of the GSSP marker
Thalmanninella globotruncanoides. The base of the Albian is correlated with the FO of Prediscosphaera columnata (et al., 1998) however in several sections the FO of this species is below ammonite and planktic foraminiferal bioevents and black shale beds that traditionally mark the base Albian.
). Most bioevent ages are consistent with the ages of the stages in which they are reported in GTS2012 ( et al.,
1992). However several events that mark stage boundaries in GTS2012 are younger in CRETCSDB3. The LO of Broinsonia parca constricta at the base
Maastrichtian is about 3 myr younger in the Maastrichtian. This species occurs above the top of magnetochron C32, which spans the
Campanian/Maastrichtian boundary in GTS2012. The FO of Arkhangelskiella cymbiformis marks the top of the Santonian and the UC12/UC13 boundary in GTS2012 however this species is reported in the Turonian in the Canadian Western Interior (et al., 1996). The base of the Cenomanian corresponds to the FO Corollithion kennedyi, which in CRETCSDB3 is scaled at 0.55 myr younger than the FO of the GSSP marker
Thalmanninella globotruncanoides. The base of the Albian is correlated with the FO of Prediscosphaera columnata (et al., 1998) however in several sections the FO of this species is below ammonite and planktic foraminiferal bioevents and black shale beds that traditionally mark the base Albian.
Click on thumbnail to enlarge the image.
Table 4: Comparison of stratigraphic order of Cretaceous calcareous nannofossil zones of et al. (1998) and (1998) with numerical ages in CRETCSDB3. Highlighted taxa are older or younger than predicted by and .
Click on thumbnail to enlarge the image.
Table 5: Comparison of numerical ages of Cretaceous calcareous nannofossil bioevents in & (2012) with ages in CRETCSDB3. Highlighted taxa are either older or younger than in GTS2012.
Formal dinocysts zones have not been defined; however the FO and LO of key species are documented ( & ,
1998; et al.,
2004). The stratigraphic ranges are controlled by latitude so that ranges are different in
low, middle and high latitudes. The dinoflagellates events in CRETCSDB3 are not latitudinally differentiated so that the FO and LO ages may differ from the published charts
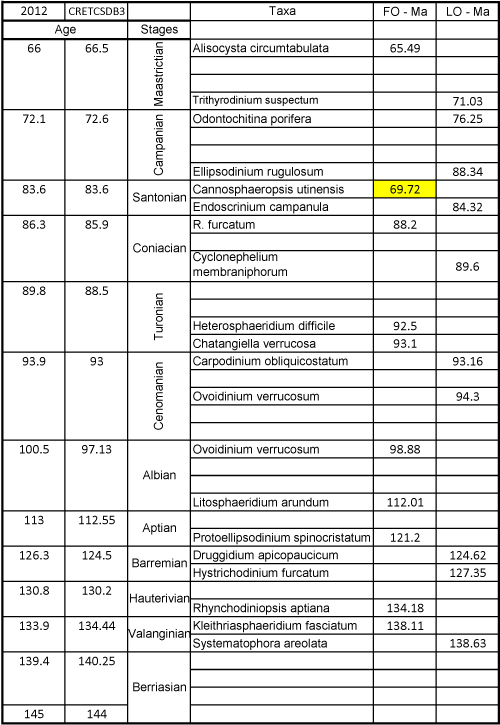
(Table 6 ![]() ). In addition the dinocyst events in CRETCSDB3 are documented in fewer sections than many other bioevents in the data set. For
example, the FO of Cannosphaeropsis utinensis is recorded in only one section in CRETCSDB3 in the Maastrichtian and its full range into the Santonian is not yet
documented. None the less, the occurrences of many species bracket stage boundaries as
predicted.
). In addition the dinocyst events in CRETCSDB3 are documented in fewer sections than many other bioevents in the data set. For
example, the FO of Cannosphaeropsis utinensis is recorded in only one section in CRETCSDB3 in the Maastrichtian and its full range into the Santonian is not yet
documented. None the less, the occurrences of many species bracket stage boundaries as
predicted.
Click on thumbnail to enlarge the image.
Table 6: Comparison of numerical ages of Cretaceous dinoflagellates first occurrences in & (2012) with ages in CRETCSDB3. The FO of Cannosphaeropsis utinensis is highlighted because it is much younger than predicted. Cretaceous dinoflagellate biostratigraphy from & (1998) and et al. (2004).
The Lower Cretaceous interval of the M-sequence magnetic anomalies spans from the Berriasian to the Aptian stages and the Upper Cretaceous C-sequence spans from Santonian through the Maastrichtian (
and , 2004;
& , 2012). These magnetochrons are constrained in the CRETCSDB3 by key sections
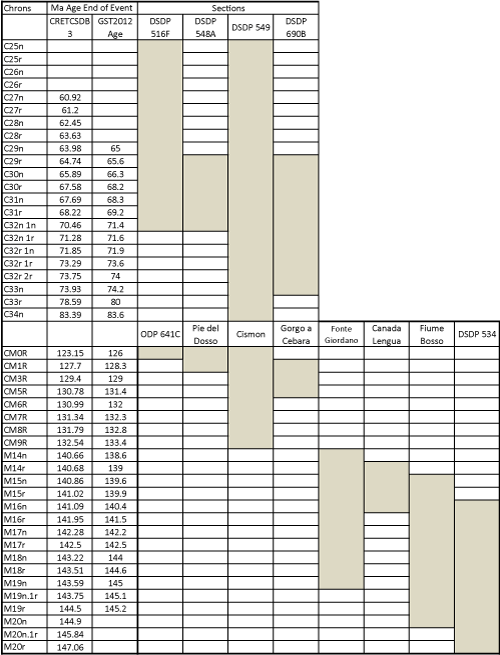
(Table 7 ![]() ). The Lower Cretaceous series CM0R-CM9R and M14n-M20r are defined in fourteen sections in
Italy, Spain, Portugal, and Poland; chrons M10n ñ M13r are not recorded in these sections. The Upper Cretaceous C-sequence C29n-C34n is controlled by five oceanic sections in the Antarctic, Southern and Northern Atlantic, and offshore England. The Maastrichtian-Danian contact is between the top of C29r at 64.74 Ma and the top of C30n at 69.89 Ma. If the Jurassic/Berriasian boundary is at M18r/M19n in the Berriasiella jacobi Zone, the age is 143.59 Ma. However if the base Berriasian is at FO of B. jacobi then the system age is 144.07 Ma.
). The Lower Cretaceous series CM0R-CM9R and M14n-M20r are defined in fourteen sections in
Italy, Spain, Portugal, and Poland; chrons M10n ñ M13r are not recorded in these sections. The Upper Cretaceous C-sequence C29n-C34n is controlled by five oceanic sections in the Antarctic, Southern and Northern Atlantic, and offshore England. The Maastrichtian-Danian contact is between the top of C29r at 64.74 Ma and the top of C30n at 69.89 Ma. If the Jurassic/Berriasian boundary is at M18r/M19n in the Berriasiella jacobi Zone, the age is 143.59 Ma. However if the base Berriasian is at FO of B. jacobi then the system age is 144.07 Ma.
Upper Cretaceous polarity chrons ages are somewhat younger in CRETCSDB3 than in GTS2012
(Table 7 ![]() ). This is the result of calibrating the Cretaceous/Paleogene boundary at 65.5 Ma in CRETCSDB3 compared to 66.0 Ma in GTS2012. However the Lower Cretaceous polarity chron ages vary considerably; some in CRETCSDB3 are younger than in GTS2012 and others are older. Few radiometric ages in the Lower Cretaceous constrain the age calibration of magnetochrons.
). This is the result of calibrating the Cretaceous/Paleogene boundary at 65.5 Ma in CRETCSDB3 compared to 66.0 Ma in GTS2012. However the Lower Cretaceous polarity chron ages vary considerably; some in CRETCSDB3 are younger than in GTS2012 and others are older. Few radiometric ages in the Lower Cretaceous constrain the age calibration of magnetochrons.
Click on thumbnail to enlarge the image.
Table 7: Comparison of numerical ages of Cretaceous magnetochrons in & (2012) with ages in CRETCSDB3. Gray columns indicate key stratigraphic sections controlling sequencing and scaling of Cretaceous magnetochrons.
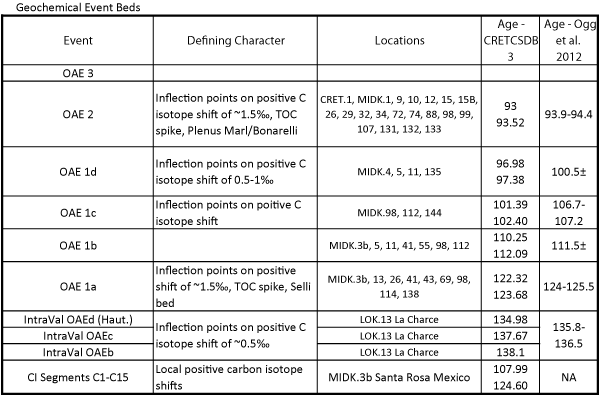
Cretaceous carbon-rich beds and carbon isotope stratigraphic events are well documented in the Cretaceous record and are tightly constrained by biostratigraphy. In CRETCSDB3 black shale beds and positive carbon isotope shifts and increases of total organic carbon were first integrated from a few key reference localities
(Table 8 ![]() ). The widespread carbon isotope shifts and black shale beds of OAE 1a, OAE 1b and OAE 2 were first documented at Santa Rosa Canyon, Mexico and at Kalaat Senan, Tunisia, respectively. Subsequently they were documented and correlated at numerous other localities including in the Piobbico Core, Marche, Italy. OAE 1c was first defined in CRETCSDB3 at Roter Sattel section, Switzerland, and the Coppa della Nuvola section, Italy. It is correlated with the Amadeus bed in the Piobbico core, Italy, and at the Coppa della Nuvola section, Italy. OAE 1d was projected into CRETCSDB3 from DSDP 547 core offshore Morocco and DSDP 386 core on the Bermuda Plateau; it is correlated with the Breistroffer bed at Mont Risou, Rosans, France, and Col de Palluel, Hautes-Alpes, France. The Upper Aptian-Lower Albian black shale beds Marker beds Niveau , , , and were first projected and scaled in CRETCSDB3 from the PrÈ-Guittard section, France.
). The widespread carbon isotope shifts and black shale beds of OAE 1a, OAE 1b and OAE 2 were first documented at Santa Rosa Canyon, Mexico and at Kalaat Senan, Tunisia, respectively. Subsequently they were documented and correlated at numerous other localities including in the Piobbico Core, Marche, Italy. OAE 1c was first defined in CRETCSDB3 at Roter Sattel section, Switzerland, and the Coppa della Nuvola section, Italy. It is correlated with the Amadeus bed in the Piobbico core, Italy, and at the Coppa della Nuvola section, Italy. OAE 1d was projected into CRETCSDB3 from DSDP 547 core offshore Morocco and DSDP 386 core on the Bermuda Plateau; it is correlated with the Breistroffer bed at Mont Risou, Rosans, France, and Col de Palluel, Hautes-Alpes, France. The Upper Aptian-Lower Albian black shale beds Marker beds Niveau , , , and were first projected and scaled in CRETCSDB3 from the PrÈ-Guittard section, France.
The IntraVal OAEb-d events in CRETCSDB3 are positive shifts of about 0.5â in the C isotope curve ( et al., 1999: Fig. 2). The lower two shifts are in the Upper Valanginian Verrucosum Zone and the highest shift is actually in the Lower Hauterivian spanning the Radiatus/Loryi Zones. A broader shift of about 1.3â spans about 35m in the Campylotoxus Zone and is not identified in CRETCSDB3. IntraVal OAEb-c events approximate the "" event of et al. (2004).
Santa Rosa Canyon section in northern Mexico is a classic North American reference section for Lower Cretaceous biostratigraphy and chemostratigraphy (MIDK.3). A detailed record of TOC%, CaCO3% and δ13Corgâ spans the Aptian-Lower Albian interval from the La PeÒa Formation into the Tamaulipas Limestone ( et al., 1999). A series of 15 positive C isotope shifts of about 1â (CI1-15) record changes in organic matter that range from below OAE 1a to above OAE 1b. These events in the Chihuahua Basin potentially may be identified in other northern Mexican sections (J. , personal communication, 2013). The Iridium anomaly that marks the top Cretaceous is projected into CRETCSDB3 from DSDP 516F in southwestern Atlantic Ocean and ODP 752A+B in the Indian Ocean.
Click on thumbnail to enlarge the image.
Table 8: Comparison of numerical ages of Cretaceous geochemical events in & (2012) with ages in CRETCSDB3.
Eccentricity cycles have been defined in a number of Cretaceous sections based on bedding composition and thickness. Cyclostratigraphic analyses have the potential to scale the duration of several stages, however, different durations have been proposed for the Albian and Cenomanian stages. Uncertainty is derived in part from using different criteria to define cycles, such as lithologic changes, mineralologic changes, gray-scale changes, and gamma ray properties ( et al., 1995). An additional source of uncertainty is from using different biostratigraphic criteria to define the base of the Albian. Furthermore, diverse correlations of the Albian/Cenomanian boundary with different radiometrically dated beds using different biostratigraphic properties and sequence stratigraphy result in different durations of the stages.
Included in CRETCSDB3 are twenty-five cycles defined in the cored Albian interval at Gubbio, Italy ( et al., 2004). These cycles are plotted with twenty-nine long-term (c. 413 kyr) eccentricity cycles at Monte Petrano, Italy ( et al., 2001; et al., 2009). Albian durations vary from 11.9 myr ( et al., 1995) to 11.6 ± 0.2 myr ( et al., 2001, 2006) and up to 12.45 myr ( et al., 2004). The estimates of the Cenomanian duration range from 4.45 myr to 6.0 ± 0.5 myr ( et al., 1995).
Cenomanian-Turonian limestone-marl cycles in the Bridge Creek Limestone Member of the Greenhorn Formation record mainly long-term eccentricity, 413 kyr, and obliquity, 50.7 kyr, cycles by spectral analysis that together scale the Bridge Creek duration at 1.57 myr ( et al., 1997).
In the Bounds core (MIDK.9), the lithologic cycles of the members of the Greenhorn Formation core are identified as correlative "marker beds" with initials of the respective lithostratigraphic units (, 1975; et al., 1998). In CRECSDB3 the durations of these marker beds range from 306,300 kyr to 43,600 kyr and average 144,266 kyr. These lettered cycles are defined differently than those of et al. (1997) and evidently do not record uniform climate cycles but they are combinations of eccentricity and obliquity frequencies.
Interbedded marl-limestone cycles are defined in the Coniacian-Santonian Niobrara Formation (Marker beds Kn 1-9; & , 1989). The average duration of these cycles is 70,846 kyr based on graphic plots suggesting that they may represent the 100 kyr eccentricity frequency ( et al., 1998). These bed sets are mapped and correlated from Kansas to the Colorado Front Range a distance of 525 km. -scale eccentricity and obliquity cycles were documented by resistivity log data and CaCO3 weight percent in the Niobrara Formation ( & , 2008).
Although most of the 3500+ events in CRETCSDB3 are marine fossils or non-biotic events, terrestrial microfossils are integrated with stage boundaries. Pollen and spore taxa are documented from sections in the Western Interior and Texas Gulf Coast. In these sections marine fossils occur together with the non-marine taxa. The large Turonian-Maastrichtian non-marine biota in the Songliao Basin has been integrated with marine and ages projected to their ranges ( et al., 2012; et al., 2013). A 2400 m core in the Songliao Basin documented the biota, magnetochrons, sparse marine foraminifera, and two radiometric dates. These markers were also in CRETCSD3 and were the common points in the graphic solution. These taxa are listed in a separate table in et al. (2012).
The Cretaceous Chronostratigraphic Database - CRETCSDB3 ñ is a compilation of more than 3500 numerically dated age-diagnostic events of the Cretaceous Period. This database is composed of major zonal index species together with magnetochrons, geochemical events, marker beds, and sequence stratigraphic contacts. The CRETCSDB3 was compiled from nearly 300 publically accessible measured sections with biostratigraphic data check-listed by professional paleontologists. It serves as a reference table of bioevent ages to be used to interpret chronostratigraphy of outcrops and cores.
The method of graphic correlation was devised by Alan and practiced by the paleontologists at the Amoco Research Center during the 1980's in Tulsa, Oklahoma and other biostratigraphers. The vision for the compilation of this Cretaceous chronostratigraphic data set began with conversations with Wolfgang followed by a month working with stratigraphers at the Free University, Amsterdam. Subsequently a number of people encouraged the prosecution of this project including Xiaoqiao and Chengshan , China University of Geosciences, Michael , University of Vienna, and Xiumian , Nanjing University. The data quality is the responsibility of so many biostratigraphers who have carefully documented deep sea cores as well as key outcrop and subsurface sections. This paper has been improved by the constructive comments by Peter and Mike .
E., M. & J.M. (2000).- The Berriasian/Valanginian boundary in the Mediterranean regiÛn.- Cretaceous Research, London, vol. 21, no 1, p. 1-21.
R.C. (2010).- Paleogeographic maps.- Colorado Plateau Geosystems, Phoenix, AZ. URL: http://cpgeosystems.com/
P.R., D.C., J.A. & L.T. (1998).- Lower Cretaceous. In: P.R. (ed.), Calcareous nannofossil biostratigraphy.- Chapman & Hall, London, p. 86-131.
T.J., R.M., W.V. & H.R. (1995).- An integrated Cretaceous microfossil biostratigraphy. In: W.A., D.V., M.-P., & J. (eds.), Geochronology time scales and global stratigraphic correlations.- Society of Sedimentary Geology (SEPM), Tulsa, Special Publication no 54, p. 65-79.
T.J., E., B., W.V., C.L. & J. (1999).- The record of global change in mid-Cretaceous (Barremian-Albian) sections from the Sierra Madre, Northeastern Mexico.- Journal of Foraminiferal Research, New York, vol. 29, p. 418-437.
J.A. (1998).- Upper Cretaceous. In: P.R. (ed.), Calcareous nannofossil biostratigraphy.- Chapman & Hall, London, p. 132-199.
J.A., W.J. & P. (1992).- Maastrichtian nannofossil biostratigraphy in the Biscay region (south-western France, northern Spain).- Newsletters on Stratigraphy, Stuttgart, vol. 26, p. 145-155.
J.L. & R.W. (1995).- Graphic correlation and composite standard databases as tools for the exploration biostratigrapher. In: K.O. & H.R. (eds.), Graphic Correlation.- SEPM (Society for Sedimentary Geology), Tulsa, Special Publication no 53, p. 23-43.
W.A., J.D., I. & K.C. (2006).- A USGS Zonal Table for the Upper Cretaceous Middle Cenomanian-Maastrichtian of the Western Interior of the United States based on ammonites, inoceramides, and radiometric ages.- U.S. Geological Survey, Denver, Open File Report 2006-1250, 45 p. URL: http://pubs.usgs.gov/of/2006/1250/pdf/OF06-1250_508.pdf
N., B. & O. (2001).- Lithostratigraphic analysis of cyclicity in pelagic Albian deposits of central Italy: implications for the duration of the stage and substage.- Cretaceous Research, London, vol. 22, no 2, p. 265-275.
N., X., O., L.G. & P.Y. (2006).- Lower Cretaceous stage durations combining radiometric data and orbital chronology: Towards a more stable relative time scale?.- Earth and Planetary Science Letters, Amsterdam, vol. 246, nos 3-4, p. 407-417.
J.-C. & E. (1998).- Dinoflagellate cysts. In: P.-C. de, P., J., T. & P. (eds.), Mesozoic and Cenozoic sequence stratigraphy of European basins.- SEPM (Society for Sedimentary Geology), Tulsa, Special Publication no 60, Chart 5.
C. (1999).- The end of the dinosaurs, Chicxulub crater and mass extinctions.- Cambridge University Press, 236 p.
C.M., R.W., H., T.F., E. & V.A. (2008).- Upper Aptian-Lower Albian Mural Formation: stratigraphy, biostratigraphy and depositional cycles on the Sonoran Shelf, northern Mexico.- Cretaceous Research, London, vol. 29, no 2, p. 249-266.
F.M. (2004).- Introduction. In: F., J.G. & A.G. (eds.), A geologic time scale.- Cambridge University Press, p. 3-19.
F.M., R.A. & P.M. (2004).- Biostratigraphy: time scales from graphic and quantitative methods, Chapter 3. In: F.M., J.G. & A.G. (eds.), A geologic time scale 2004.- Cambridge University Press, p. 49-54.
F.M., J.G., M. & G. (eds., 2012).- The geologic time scale 2012 2-Volume Set.- Elsevier, Amsterdam, 1176 p.
A., A., L.A., T.D. & I. (2004).- Cyclostratigraphy and chronology of the Albian Stage (Piobbico core, Italy).- In: B., A.G., I., H. & V. (eds.), Cyclostratigraphy: An essay of approaches and case histories.- SEPM (Society for Sedimentology), Tulsa, Special Publication no 81, p. 57-81.
P.A. & W.B. (2007).- Stratigraphy and paleoecology of the middle Pierre Shale along the Missouri River, central South Dakota.- Geological Society of America, Denver, Special Publication no 427, p. 51-69.
J., J., M.B., T., P.-C. de & P. (1998).- Mesozoic and Cenozoic sequence chronostratigraphic framework of European basins. In: P.-C. de, P., J., T. & P. (eds.), Mesozoic and Cenozoic sequence stratigraphy of European basins.- SEPM (Society for Sedimentary Geology), Tulsa, Special Publication no 60, p. 3-13.
W.B., R.L., A.V., L.E., A.G. & D.G. (1990).- A geological time scale 1989.- Cambridge University Press, 263 p.
D. (1975).- Stratigraphy and depositional environments of the Greenhorn Limestone (Upper Cretaceous) of Kansas.- Kansas Geological Survey, Lawrence, Bulletin 209, 128 p. URL: http://www.kgs.ku.edu/Publications/Bulletins/209/
S., H. & L. (1999).- C-isotope stratigraphy, a calibration tool between ammonite- and magnetostratigraphy. The Valanginian-Hauterivian transition.- Geologica Carpathica, Bratislava, vol. 50, no 1, p. 91-96.
T.D., S.L., I., E. & A.G. (1995).- Orbital chronology of Cretaceous-early Palaeocene marine sediments. In: W.W., D.V., M.-.P & J. (eds.), Geochronology, time scales and global stratigraphic correlation.- SEPM (Society for Sedimentary Geology), Tulsa, Special Publication no 54, p. 81-94.
J.F., J.D. & L. (1999).- Magnetostratigraphy, isotopic age calibration and intercontinental correlation of the Red Bird section of the Pierre Shale, Niobrara County, Wyoming, USA.- Cretaceous Research, London, vol. 20, no 1, p. 1-27.
G.A., W.A., G.B. & J.D. (1998).- 40Ar/39Ar age of the Manson impact structure, Iowa, and correlative impact ejecta in the Crow Creek Member of the Pierre Shale (Upper Cretaceous), South Dakota and Nebraska.- Geological Society of America Bulletin, Denver, vol. 110, no 3, p. 361ñ376.
J., A.S., P.R., M., R.J., D. & D.S. (2000a).- Integrated stratigraphy across the Aptian-Albian boundary in the Marnes Bleues, at the Col de PrÈ-Guittard, Arnayon (DrÙme), and at Tartonne (Alpes-de-Haute-Provence), France: a candidate Global Boundary Stratotype Section and Boundary Point for the base of the Albian Stage.- Cretaceous Research, London, vol. 21, no 5, p. 591-720.
W.J., I. & W.A. (2000b).- Pueblo, Colorado,USA, candidate global boundary stratotype section and point for the base of the Turonian Stage of the Cretaceous and for the middle Turonian substage, with a revision of the Inoceramidae (bivalve).- Acta Geologica Polonica, Warsaw, vol. 50, no 3, p. 295-334.
J., A.S., J.A. & M. (2004).- The global boundary stratotype section and point (GSSP) for the base of the Cenomanian Stage, Mont Risou, Hautes-Alpes, France.- Episodes, Beijing, vol. 27, no 1, p. 21-32.
W.J., W.A., J.M. & A.S. (2005).- Upper Albian and Lower Cenomanian ammonites from the Main Street Limestone, Grayson Marl and Del Rio Clay in northeast Texas.- Cretaceous Research, London, vol. 26, no 3, p. 349-428.
A.P. & D.E. (1989).- Use of rhythmic bedding patterns for locating structural features, Niobrara Formation, United States Western Interior.- American Association of Petroleum Geologist Bulletin, Tulsa, vol. 73, no 5, p. 630-640.
M.A. & C.R.C. (2007).- Carbon and oxygen stable isotopes across the Coniacian/Santonian boundary at Olazagutia, northern Spain.- Cretaceous Research, London, vol. 28, no 1, p. 37-45.
R.E. & B.B. (2008).- Cyclostratigraphy of the Upper Cretacous Niobrara Formation, Western Interior, U.S.A.: A ConiacianñSantonian orbital timescale.- Earth and Planetary Science Letters, Amsterdam, vol. 269, nos 3-4, p. 540-553.
J., A., F.W., H.G., A., W. & D. (2003).- The Vˆhrum section (northwest Germany) and the Aptian/Albian Boundary.- Cretaceous Research, London, vol. 24, no 2, p. 203-252.
F.E., D.G. Jr, R.W., J.M., M.J. & J. (2007).- Re-evaluation of the Albian-Cenomanian Boundary in the U.S. Western Interior based on Dinoflagellate Cysts.- Review of Palæobotany and Palynology, London, vol. 144, no 1, p. 77-97.
F.E., J.H., R.W., S.L., M.J., D.G. Jr & L.M. (2008).- Anatomy of Epicontinental Flooding: Late Albian-Early Cenomanian of the Southern U.S. Western Interior. In: B.R. & C. (eds.), Dynamics of epeiric seas.- Geological Association of Canada, St. John's, NL, Special Publication no 48, p. 201-227.
J.D. (1993).- A Cretaceous time scale.- Geological Association of Canada, St. John's, NL, Special Paper no 39, p. 379-396.
J.D., T., T. & Y. (2002).- Integrated biostratigraphic and radiometric study on the Lower Cenomanian (Cretaceous) of Hokkaido, Japan.- Proceedings of the Japan Academy, Tokyo, vol. 78 (ser. B), p. 149-153.
G.S. (1994).- Geologic time scale (1994).- Comptes rendus de l'AcadÈmie des Sciences, Paris, (sÈrie II), t. 318, p. 59-71.
G.S. (1996).- Definition of a global boundary stratotype section and point for the Campanian/Maastrichtian boundary.- Bulletin de l'Institut royal des Sciences Naturelles de Belgique, Brussels, (Sciences de la Terre), SupplÈment 66, p. 111-117.
G.S. & M.A. (2001).- The global Campanian-Maastichtian stage boundary.- Episodes, Beijing, vol. 24, p. 229-238.
J.G., F.P. & F.M. (2004).- The Cretaceous Period. In: F., J.G. & A.G. (eds.), A geologic time scale.- Cambridge University Press, p. 344-383.
J.G. & A.G. (2004).- The geomagnetic polarity time scale. In: F., J.G. & A.G. (eds.), A geologic time scale.- Cambridge University Press, p. 63-86.
J.G., G. & F.M. (2008).- The concise geologic time scale.- Cambridge University Press, 184 p.
J.G. & L.A. (2012).- Cretaceous. In: F.M., J.G., M. & G. (eds.), The geologic time scale 2012.- Elsevier B.V., Amsterdam, p. 793-853.
T.C., D., T.F., J.M. & C.M. (2005).- Sedimentary basins of the backarc region in north-central Sonora, Mexico: a record of Late Jurassic extension and earliest Cretaceous arc accretion.- Geological Society of America, Denver, Abstract with Programs 37, no 7, p. 442.
I. & W.V. (2002).- Practical manual of Cretaceous planktonic foraminifera.- Dipartmento di Scienze della Terra, University of Perugia, International School on Planktonic Foraminifera, 1o course: Cretaceous, 462 p.
S., P.F., J.A., M.B., R., R., M., C., V.I., A., B., V., H., Z., E.J., D., S., T.N., L.G., J.-L., I.A., P. & O. (2010).- Report on the 4th International Meeting of the IUGS Lower Cretaceous Ammonite.- Cretaceous Research, London, vol. 30, no 2, p. 496-502.
F., M., C., F., J.M., D., J., S., F. & R. (1990).- A tentative integrated stratigraphy in the Turonian of Central Tunisia: Formations, zones and sequential stratigraphy in the Kalaat Senan area.- Bulletin des Centres de Recherches Exploration-Production elf-aquitaine, Pau, vol. 14, p. 213-384 (44 Pls.).
B.B., J., M.A., G.E. & W.E. (1997).- Evidence for periodicities in Cenomanian-Turonian lithologic and geochemical cycles, Western Interior, U.S.A.- Journal of Sedimentary Research, Tulsa, vol. 67, no 2, p. 286-302.
C.J., D.A., J., J., D.J. & P.J. (1996).- Paleoenvironmental changes in the Cretaceous (Albian to Turonian) Colorado Group of western Canada: microfossil, sedimentological and geochemical evidence.- Cretaceous Research, London, vol. 17, no 3, p. 311-365.
R.W. (2007).- Calibration of the Albian/Cenomanian boundary by ammonite biostratigraphy: U.S. Western Interior.- Acta Geological Sinica, Beijing, vol. 81, no 6, p. 940-948.
R.W. (2009).- Chronostratigraphic database for Upper Cretaceous Oceanic Red Beds (CORBs). In: X., C., L., R.W. & M. (eds.), Cretaceous oceanic redbeds: A clue to ocean/climate change.- SEPM (Society for Sedimentary Geology), Tulsa, Special Publication no 91, p. 31-53.
R.W., P.C., M.J., J.A. & J.A. (1998).- Timing of Mid-Cretaceous relative sea level changes in the Western Interior: Amoco No. 1 Bounds Core. In: W.A. & M.A. (eds.), Stratigraphy and paleoenvironments of the Cretaceous Western Interior Seaway, USA.- SEPM (Society for Sedimentary Geology), Tulsa, SEPM Concepts in Sedimentology and Paleontology, no 6, p. 11-34.
R.W., F.E., D.G. & J.M. (2009).- Numerical age calibration of the Ablian/Cenomanian boundary.- Stratigraphy, New York, vol. 6, no 1, p. 17-32.
R.W., X., C. & Q. (2012).- Late Cretaceous chronostratigraphy (TuronianñMaastrichtian): SK1 Core Songliao Basin, China.- Geoscience Frontiers, Beijing, vol. 3, no 4, p. 357-367.
X., R.W., W., L. & Y. (2011).- Early Cretaceous stratigraphy and SHRIMP U-Pb age constrain the ValanginianñHauterivian boundary in southern Tibet.- Lethaia, Oslo, vol. 44, no 2, p. 231-244.
Xiaoqiao, Jing, R.W., P., Z., Q. & D. (2013).- Late Cretaceous Stratigraphy, Songliao Basin, NE China: SK1 Cores.- Palæogeography, Palæoclimatology, Palæoecology, Amsterdam, vol. 385, p. 31-43.
G.L., H., M.A., R.A. & J.W.
(2004).- Southern Ocean and global dinoflagellate cyst events compared: Index events for the Late Cretaceous-Neogene. In: N.F., J.P. & M.J. (eds.),
The Tasmanian gateway between Australia and Antarctica. Paleoclimate and
paleoceanography.- Proceedings of the Ocean Drilling Program, Scientific Results, College Station,
TX, vol. 189, p. 1-98.
Appendices available hereafter or through the 'CRETCSDB' link at http://precisionstratigraphy.com/CRETCSDB.html