![]()
![]()
![]() Variability in the test of Globorotalia menardii
during the past 8 million years has been investigated at DSDP Site 502A (Caribbean Sea) and DSDP Site 503A (Eastern Equatorial Pacific).
Measurements were made of spire height (∂x), maximum diameter (∂y), the tangent angles of the upper and lower peripheral keels
(Φ1, Φ2, respectively), the number of chambers in the final whorl, and the area of the silhouette in keel view. Four morphotypes
alpha, beta, gamma, and delta were distinguished. Morphotype alpha was found in strata ranging in age
from the Late Miocene through the Holocene. It shows a continuous increase in ∂x and ∂y until the Late Pleistocene. During
and after the final closure of the ancient Central American Seaway (between 2.4 Ma and 1.8 Ma) there was a rapid increase in the area
of the test in keel view. At the Caribbean Sea site, morphotype beta evolved during the past 0.22 Ma. It is less inflated than
alpha and has a more delicate test. In the morphospace of ∂x vs. ∂y, morphotypes alpha and beta can be
distinguished by a separation line ∂y = 3.2 * ∂x - 160 (∂x and ∂y in µm). Plots of morphotype alpha
are below that line, those of beta are above it. Morphotype alpha is taken to be
Globorotalia menardii menardii
, &
(1865) and includes
G. menardii 'A' (1970). Morphotype beta is identified as
G. menardii cultrata (d'). Morphotypes gamma and delta are extinct Upper Miocene to Pliocene forms which evolved from morphotype alpha. They have a narrower Φ1 angle and more chambers (≥7) than morphotype alpha commonly with 5 to 6 chambers (7 in transitional forms). In contemporaneous samples morphotype delta can be distinguished from gamma by a smaller value of Φ1 and 8 or more chambers in the final whorl. Morphotype gamma is taken to be G. limbata (,
1902) and includes the junior synonym G. menardii 'B'
(1970). Morphotype delta is G. multicamerata &
(1930). With the exception of the Late Pleistocene development of G. menardii cultrataonly in the Caribbean the morphological changes of G. menardii at DSDP Sites 502A and 503A are similar. The development from the ancestral G. menardii menardii of the G. limbata - G. multicamerata lineage during the Pliocene and of G. menardii cultrata during the Late Pleistocene suggests responses at the two sites to a changing palaeoceanography during and after the formation of the Isthmus of Panama.
Variability in the test of Globorotalia menardii
during the past 8 million years has been investigated at DSDP Site 502A (Caribbean Sea) and DSDP Site 503A (Eastern Equatorial Pacific).
Measurements were made of spire height (∂x), maximum diameter (∂y), the tangent angles of the upper and lower peripheral keels
(Φ1, Φ2, respectively), the number of chambers in the final whorl, and the area of the silhouette in keel view. Four morphotypes
alpha, beta, gamma, and delta were distinguished. Morphotype alpha was found in strata ranging in age
from the Late Miocene through the Holocene. It shows a continuous increase in ∂x and ∂y until the Late Pleistocene. During
and after the final closure of the ancient Central American Seaway (between 2.4 Ma and 1.8 Ma) there was a rapid increase in the area
of the test in keel view. At the Caribbean Sea site, morphotype beta evolved during the past 0.22 Ma. It is less inflated than
alpha and has a more delicate test. In the morphospace of ∂x vs. ∂y, morphotypes alpha and beta can be
distinguished by a separation line ∂y = 3.2 * ∂x - 160 (∂x and ∂y in µm). Plots of morphotype alpha
are below that line, those of beta are above it. Morphotype alpha is taken to be
Globorotalia menardii menardii
, &
(1865) and includes
G. menardii 'A' (1970). Morphotype beta is identified as
G. menardii cultrata (d'). Morphotypes gamma and delta are extinct Upper Miocene to Pliocene forms which evolved from morphotype alpha. They have a narrower Φ1 angle and more chambers (≥7) than morphotype alpha commonly with 5 to 6 chambers (7 in transitional forms). In contemporaneous samples morphotype delta can be distinguished from gamma by a smaller value of Φ1 and 8 or more chambers in the final whorl. Morphotype gamma is taken to be G. limbata (,
1902) and includes the junior synonym G. menardii 'B'
(1970). Morphotype delta is G. multicamerata &
(1930). With the exception of the Late Pleistocene development of G. menardii cultrataonly in the Caribbean the morphological changes of G. menardii at DSDP Sites 502A and 503A are similar. The development from the ancestral G. menardii menardii of the G. limbata - G. multicamerata lineage during the Pliocene and of G. menardii cultrata during the Late Pleistocene suggests responses at the two sites to a changing palaeoceanography during and after the formation of the Isthmus of Panama.
![]() Globorotalia menardii; Neogene;
evolution; Isthmus of Panama; morphometrics
Globorotalia menardii; Neogene;
evolution; Isthmus of Panama; morphometrics
M. (2007).- Morphological variability of Globorotalia menardii (planktonic foraminifera) in two DSDP cores from the Caribbean Sea and the Eastern Equatorial Pacific.- Carnets de Géologie / Notebooks on Geology, Brest, Article 2007/04 (CG2007_A04)
![]() Variabilit�
morphologique de Globorotalia menardii (foraminif�re planctonique) dans deux carottes DSDP provenant respectivement de la Mer
Caraïbe et de la partie orientale du Pacifique équatorial.- La
variabilit� du test de Globorotalia menardii au cours des 8 derniers millions
d'ann�es a �t� �tudi�e � partir des sites DSDP 502A (Mer Caraïbe) et 503A
(partie orientale du Pacifique �quatorial). Ont �t� mesur�s la hauteur de
spire (∂x), le diam�tre maximum (∂y), les angles tangents des car�nes
p�riph�riques sup�rieure et inf�rieure (Φ1, Φ2, respectivement),
le nombre de loges dans le dernier tour, et la surface de la silhouette en vue
de profil. Quatre morphotypes : alpha, beta, gamma
et delta ont �t� distingu�s. Le morphotype alpha a �t� rencontr� dans des couches allant du
Mioc�ne sup�rieur jusqu'� l'Holoc�ne. Il montre un accroissement continu
du ∂x et du ∂y jusqu'au Pl�istoc�ne sup�rieur. Pendant et apr�s la fermeture definitive de
l'ancien bras de mer passant � travers l'Am�rique Centrale (entre 2,4 et
1,8 Ma), il se produit un rapide accroissement de la surface du test en vue car�nale.
Au site caraïbe, le morphotype beta a �volu� durant les derniers 220
milliers d'ann�es.
Il est moins renfl� que le morphotype alpha et poss�de un test plus mince.
Dans l'espace morphologique d�fini par ∂x vs. ∂y, les
morphotypes alpha and beta peuvent �tre distingu�s par une ligne de s�paration
d�finie par ∂y = 3.2 * ∂x - 160 (∂x et ∂y en �m).
Les valeurs obtenues pour le morphotype alpha se situent en dessous de cette
ligne, celles du morphotype beta sont au dessus. Le morphotype alpha est
determin� comme �tant Globorotalia
menardii menardii , &
(1865) et il inclut G.
menardii 'A' (1970). Le morphotype beta est identifi� comme �tant G.
menardii cultrata (d'). Les morphotypes gamma and delta sont des
formes, aujourd'hui disparues, qui ont exist� du Mioc�ne sup�rieur au Plioc�ne,
en �voluant � partir du morphotype alpha. Elles ont un angle Φ1 plus aigu
et un plus grand nombre de loges (≥7) que le morphotype alpha, qui poss�de
en g�n�ral 5 � 6 loges (7 chez les formes de transition). Dans des �chantillons de m�me �ge, le morphotype delta peut �tre distingu� du gamma par une valeur
plus faible de Φ1 et 8 ou plus de 8 loges dans le dernier tour. Le morphotype gamma est determin� comme �tant G. limbata (, 1902) et inclut le synonyme plus r�cent G. menardii 'B'
(1970).
Le morphotype delta est G. multicamerata &
(1930). A l'exception du d�veloppement au Pl�istoc�ne sup�rieur, uniquement dans le domaine cara�be, de G. menardii cultrata, les changements morphologiques
de G. menardii dans les deux sites DSDP 502A et 503A sont identiques. L'�volution de la lign�e G.
limbata - G. multicamerata durant le Plioc�ne et celle de G. menardii cultrata durant le Pl�istoc�ne sup�rieur, toutes deux � partir de l'anc�tre G.
menardii menardii, peuvent �tre interpr�t�es comme une r�ponse dans les deux sites � un changement d'ordre
pal�og�ographique, pendant et apr�s la formation de l'Isthme de Panam�.
Variabilit�
morphologique de Globorotalia menardii (foraminif�re planctonique) dans deux carottes DSDP provenant respectivement de la Mer
Caraïbe et de la partie orientale du Pacifique équatorial.- La
variabilit� du test de Globorotalia menardii au cours des 8 derniers millions
d'ann�es a �t� �tudi�e � partir des sites DSDP 502A (Mer Caraïbe) et 503A
(partie orientale du Pacifique �quatorial). Ont �t� mesur�s la hauteur de
spire (∂x), le diam�tre maximum (∂y), les angles tangents des car�nes
p�riph�riques sup�rieure et inf�rieure (Φ1, Φ2, respectivement),
le nombre de loges dans le dernier tour, et la surface de la silhouette en vue
de profil. Quatre morphotypes : alpha, beta, gamma
et delta ont �t� distingu�s. Le morphotype alpha a �t� rencontr� dans des couches allant du
Mioc�ne sup�rieur jusqu'� l'Holoc�ne. Il montre un accroissement continu
du ∂x et du ∂y jusqu'au Pl�istoc�ne sup�rieur. Pendant et apr�s la fermeture definitive de
l'ancien bras de mer passant � travers l'Am�rique Centrale (entre 2,4 et
1,8 Ma), il se produit un rapide accroissement de la surface du test en vue car�nale.
Au site caraïbe, le morphotype beta a �volu� durant les derniers 220
milliers d'ann�es.
Il est moins renfl� que le morphotype alpha et poss�de un test plus mince.
Dans l'espace morphologique d�fini par ∂x vs. ∂y, les
morphotypes alpha and beta peuvent �tre distingu�s par une ligne de s�paration
d�finie par ∂y = 3.2 * ∂x - 160 (∂x et ∂y en �m).
Les valeurs obtenues pour le morphotype alpha se situent en dessous de cette
ligne, celles du morphotype beta sont au dessus. Le morphotype alpha est
determin� comme �tant Globorotalia
menardii menardii , &
(1865) et il inclut G.
menardii 'A' (1970). Le morphotype beta est identifi� comme �tant G.
menardii cultrata (d'). Les morphotypes gamma and delta sont des
formes, aujourd'hui disparues, qui ont exist� du Mioc�ne sup�rieur au Plioc�ne,
en �voluant � partir du morphotype alpha. Elles ont un angle Φ1 plus aigu
et un plus grand nombre de loges (≥7) que le morphotype alpha, qui poss�de
en g�n�ral 5 � 6 loges (7 chez les formes de transition). Dans des �chantillons de m�me �ge, le morphotype delta peut �tre distingu� du gamma par une valeur
plus faible de Φ1 et 8 ou plus de 8 loges dans le dernier tour. Le morphotype gamma est determin� comme �tant G. limbata (, 1902) et inclut le synonyme plus r�cent G. menardii 'B'
(1970).
Le morphotype delta est G. multicamerata &
(1930). A l'exception du d�veloppement au Pl�istoc�ne sup�rieur, uniquement dans le domaine cara�be, de G. menardii cultrata, les changements morphologiques
de G. menardii dans les deux sites DSDP 502A et 503A sont identiques. L'�volution de la lign�e G.
limbata - G. multicamerata durant le Plioc�ne et celle de G. menardii cultrata durant le Pl�istoc�ne sup�rieur, toutes deux � partir de l'anc�tre G.
menardii menardii, peuvent �tre interpr�t�es comme une r�ponse dans les deux sites � un changement d'ordre
pal�og�ographique, pendant et apr�s la formation de l'Isthme de Panam�.
![]() Globorotalia menardii ; N�og�ne ; �volution ; Isthme de Panam� ; morphom�trie
Globorotalia menardii ; N�og�ne ; �volution ; Isthme de Panam� ; morphom�trie
![]() Speciation in planktonic microorganisms is still a poorly understood process. According to traditional ideas new species develop when permanent isolation prevents reproduction between coexisting, cohabiting populations (,
1935; , 1967). During and after their stabilization, the isolated populations diverge, their differentiation often reflected by morphological changes in the descendents. If speciation is accompanied by morphological divergence through time, the splitting process (cladogenesis) can be observed in microfossils preserved in sediments. Interbreeding planktonic populations are large and widely distributed in the seas. On both seasonal and annual time scales survival of the plankton depends on population density, dispersal of individuals, and on ontogenetic maturation in synchrony with food availability, which is controlled by the seasonal dynamics of watermasses and currents. Over millennia cladogenesis can occur in the watercolumn geographically and/or vertically through the perennial establishment of geographical, chemical, nutritional or watermass boundaries. Also repeated seasonal isolation can lead to permanent reproductive isolation between formerly interbreeding plankton populations.
Speciation in planktonic microorganisms is still a poorly understood process. According to traditional ideas new species develop when permanent isolation prevents reproduction between coexisting, cohabiting populations (,
1935; , 1967). During and after their stabilization, the isolated populations diverge, their differentiation often reflected by morphological changes in the descendents. If speciation is accompanied by morphological divergence through time, the splitting process (cladogenesis) can be observed in microfossils preserved in sediments. Interbreeding planktonic populations are large and widely distributed in the seas. On both seasonal and annual time scales survival of the plankton depends on population density, dispersal of individuals, and on ontogenetic maturation in synchrony with food availability, which is controlled by the seasonal dynamics of watermasses and currents. Over millennia cladogenesis can occur in the watercolumn geographically and/or vertically through the perennial establishment of geographical, chemical, nutritional or watermass boundaries. Also repeated seasonal isolation can lead to permanent reproductive isolation between formerly interbreeding plankton populations.
![]() Because of the extremely long time (tens to hundred thousands of years) required for speciation, its direct observation is impossible in nature. Overcoming this difficulty requires a careful selection of organisms with large populations and exceptionally fast reproduction, along with high rates of genetic change (bacteria, fruit flies), and exposure to mutagenic conditions. But such experiments are artificial and do not reflect natural situations. Microfossils provide a powerful means of studying speciation in the geological past. Under the assumption that fossil species are recognizable by their morphologies, ancestor�to�descendent relationships can be reconstructed from the sedimentary record. This approach requires that the full range of morphological variability through time and geography be quantified. The literature on such studies is still limited.
Because of the extremely long time (tens to hundred thousands of years) required for speciation, its direct observation is impossible in nature. Overcoming this difficulty requires a careful selection of organisms with large populations and exceptionally fast reproduction, along with high rates of genetic change (bacteria, fruit flies), and exposure to mutagenic conditions. But such experiments are artificial and do not reflect natural situations. Microfossils provide a powerful means of studying speciation in the geological past. Under the assumption that fossil species are recognizable by their morphologies, ancestor�to�descendent relationships can be reconstructed from the sedimentary record. This approach requires that the full range of morphological variability through time and geography be quantified. The literature on such studies is still limited.
![]() A major difficulty in foraminiferal taxonomy is that clinal morphological changes due to coadaptation to similar environmental gradients can produce morphological sequences that mimic evolutionary change. Furthermore, migration of similar forms from neighbouring areas can mask evolutionary or ecophenotypic signals in the sediments. Because of these difficulties, an evolutionary study must attempt to separate
environmentally-caused morphological signals from those that occur due to non-environmental genetic changes. Molecular taxonomy is one way to do this as was demonstrated impressively by et alii
(1996), et alii
(1997), et alii
(1997), et alii
(2001), et alii
(1999), et alii
(2000), &
(2002), and et alii
(2004). Obviously, in extinct species this approach is not possible. Under some circumstances solutions can be found using stable isotope chemistry to reconstruct preferences in the depth habitat ( et alii,
1996; et alii, 1997; ,
1998). A third solution is the careful monitoring of morphological changes through time in a selected microfossil lineage in discrete geographic areas where the paleoceanographic history is known a priori. This is the strategy used here.
A major difficulty in foraminiferal taxonomy is that clinal morphological changes due to coadaptation to similar environmental gradients can produce morphological sequences that mimic evolutionary change. Furthermore, migration of similar forms from neighbouring areas can mask evolutionary or ecophenotypic signals in the sediments. Because of these difficulties, an evolutionary study must attempt to separate
environmentally-caused morphological signals from those that occur due to non-environmental genetic changes. Molecular taxonomy is one way to do this as was demonstrated impressively by et alii
(1996), et alii
(1997), et alii
(1997), et alii
(2001), et alii
(1999), et alii
(2000), &
(2002), and et alii
(2004). Obviously, in extinct species this approach is not possible. Under some circumstances solutions can be found using stable isotope chemistry to reconstruct preferences in the depth habitat ( et alii,
1996; et alii, 1997; ,
1998). A third solution is the careful monitoring of morphological changes through time in a selected microfossil lineage in discrete geographic areas where the paleoceanographic history is known a priori. This is the strategy used here.
![]() The above context is the rationale of a research project "Speciation of marine calcareous planktonic microfossils during the Cenozoic", for which was selected the extant tropical Neogene planktonic foraminiferal plexus of Globorotalia menardii and its two extinct Pliocene descendants Globorotalia limbata and Globorotalia multicamerata. This group is ideal for study because of its well�known tropical to subtropical palaeobiogeography ( et alii,
1966; & ,
1976; & ,
1979), which permits the recognition of climatic perturbations. Also, these forms have been reported by several micropaleontologists to be related phylogenetically (see section Taxonomic Concept below). Unfortunately, the G. menardii group has not yet been subject to much detailed molecular phylogenetic analysis, which would help to distinguish morphologically similar species. However, in the modern ocean G. menardii lives in the upper 100 metres of the water column ( & ,
1991; et alii,
2007) and so is amenable to genetic mapping. The majority of menardiform globorotalias are reasonably resistant to calcite dissolution ( & ,
1967), which increases the probability of recording them on a global scale.
The above context is the rationale of a research project "Speciation of marine calcareous planktonic microfossils during the Cenozoic", for which was selected the extant tropical Neogene planktonic foraminiferal plexus of Globorotalia menardii and its two extinct Pliocene descendants Globorotalia limbata and Globorotalia multicamerata. This group is ideal for study because of its well�known tropical to subtropical palaeobiogeography ( et alii,
1966; & ,
1976; & ,
1979), which permits the recognition of climatic perturbations. Also, these forms have been reported by several micropaleontologists to be related phylogenetically (see section Taxonomic Concept below). Unfortunately, the G. menardii group has not yet been subject to much detailed molecular phylogenetic analysis, which would help to distinguish morphologically similar species. However, in the modern ocean G. menardii lives in the upper 100 metres of the water column ( & ,
1991; et alii,
2007) and so is amenable to genetic mapping. The majority of menardiform globorotalias are reasonably resistant to calcite dissolution ( & ,
1967), which increases the probability of recording them on a global scale.
![]() In order to detect the morphological variability and eventual speciation in menardiform globorotalias two open marine DSDP Sites 502A and 503A were chosen; these sites are located on either side of the Isthmus of Panama. There, tropical Atlantic and Pacific plankton populations have progressively and permanently separated from each other during the course of Neogene plate tectonic activity (see section The emergence of the Isthmus of Panama
further below). The thrust of this study is that trans-isthmian tropical planktonic populations of G. menardii have diverged morphologically as the two oceans became separated. This prediction can be tested by measuring the morphological variations of specimens in at least two suites of cores, from wells located on either side of the Central American Landbridge (see
Fig. 1
In order to detect the morphological variability and eventual speciation in menardiform globorotalias two open marine DSDP Sites 502A and 503A were chosen; these sites are located on either side of the Isthmus of Panama. There, tropical Atlantic and Pacific plankton populations have progressively and permanently separated from each other during the course of Neogene plate tectonic activity (see section The emergence of the Isthmus of Panama
further below). The thrust of this study is that trans-isthmian tropical planktonic populations of G. menardii have diverged morphologically as the two oceans became separated. This prediction can be tested by measuring the morphological variations of specimens in at least two suites of cores, from wells located on either side of the Central American Landbridge (see
Fig. 1 ![]() ). If this prediction is validated the present study may serve as a basis for further investigations at other control sites in order to map the dynamics and geography of allopatric speciation. If the prediction is unsound reasons for its failure must be found and the speciation model presented here must be revised.
). If this prediction is validated the present study may serve as a basis for further investigations at other control sites in order to map the dynamics and geography of allopatric speciation. If the prediction is unsound reasons for its failure must be found and the speciation model presented here must be revised.
![]() The emergence of the Isthmus of Panama provides an ideal natural laboratory for study of the evolutionary effects of isolation on previously interconnected populations of planktonic foraminifera. The sequence of events leading to the emergence of the isthmus has been extensively investigated and the date of the final closure has been estimated with some degree of accuracy. The sedimentary record of the Eastern Tropical Pacific and the Caribbean Sea is influenced by a complex interplay of phases of tectonic uplift and volcanism from Guatemala to Panama. Carbonate dissolution is common in the Caribbean Sea before 4.6 Ma ( & ,
1998), and in the western Caribbean periods of more intense upwelling during the Upper Miocene are known ( et alii,
1989; , 1996) as well as from off the coasts of Peru and Ecuador (,
1976; et alii,
1995; , 1990; et alii,
1996). The closure of the ancient sea-connection strengthened the Gulf Stream. Through its transport of moisture to the north, the Gulf Stream amplified late Cenozoic Northern Hemisphere glaciation and influenced late Neogene glacio-eustatic fluctuations in sea level ( et alii,
1995; et alii, 1998). Initial tectonic uplift of the Panama Sill occurred during the early middle Miocene ( & ,
1985; , 1990, et alii,
2003). West to east exchanges of intermediate to shallow watermasses were unrestricted from the Atlantic to the Pacific Ocean until the Middle to Late Miocene
(Fig. 2
The emergence of the Isthmus of Panama provides an ideal natural laboratory for study of the evolutionary effects of isolation on previously interconnected populations of planktonic foraminifera. The sequence of events leading to the emergence of the isthmus has been extensively investigated and the date of the final closure has been estimated with some degree of accuracy. The sedimentary record of the Eastern Tropical Pacific and the Caribbean Sea is influenced by a complex interplay of phases of tectonic uplift and volcanism from Guatemala to Panama. Carbonate dissolution is common in the Caribbean Sea before 4.6 Ma ( & ,
1998), and in the western Caribbean periods of more intense upwelling during the Upper Miocene are known ( et alii,
1989; , 1996) as well as from off the coasts of Peru and Ecuador (,
1976; et alii,
1995; , 1990; et alii,
1996). The closure of the ancient sea-connection strengthened the Gulf Stream. Through its transport of moisture to the north, the Gulf Stream amplified late Cenozoic Northern Hemisphere glaciation and influenced late Neogene glacio-eustatic fluctuations in sea level ( et alii,
1995; et alii, 1998). Initial tectonic uplift of the Panama Sill occurred during the early middle Miocene ( & ,
1985; , 1990, et alii,
2003). West to east exchanges of intermediate to shallow watermasses were unrestricted from the Atlantic to the Pacific Ocean until the Middle to Late Miocene
(Fig. 2 ![]() ). During the Late Miocene and throughout the Pliocene transoceanic circulation became restricted and so reduced gene flow between Atlantic and Pacific populations (,
1990; et alii,
1992; et alii,
1995; et alii,
1996; et alii, 2000). Around 6 Ma a jet of the Pacific North Equatorial Counter current-Equatorial undercurrent passed through a narrow isthmian strait into the Caribbean Sea ( et alii,
1996). Major events in the impending progressive closure of the Pacific-Caribbean gateway were documented at 4.2 Ma and 2.4 Ma (2.55 Ma according to the time scale of et alii,
1995)
(Fig. 3
). During the Late Miocene and throughout the Pliocene transoceanic circulation became restricted and so reduced gene flow between Atlantic and Pacific populations (,
1990; et alii,
1992; et alii,
1995; et alii,
1996; et alii, 2000). Around 6 Ma a jet of the Pacific North Equatorial Counter current-Equatorial undercurrent passed through a narrow isthmian strait into the Caribbean Sea ( et alii,
1996). Major events in the impending progressive closure of the Pacific-Caribbean gateway were documented at 4.2 Ma and 2.4 Ma (2.55 Ma according to the time scale of et alii,
1995)
(Fig. 3 ![]() ). The date of the final closure of the
Central American Seaway is somewhat controversial ( et alii,
1998): In older literature it is reported to have occurred during the Early Pliocene between 3.5 to 3.1 Ma (,
1976; , 1978; ,
1990). According to &
(2007) and references therein, complete closure of the Central American Seaway occurred between 4.2 and 3.5 Ma, with occasional breaches of the isthmian barrier until 2.88 Ma to 2.76 Ma. Analysis of calcareous nannoplankton by &
(2000) demonstrated final closure to be to have occurred after 2.76 Ma. Using the maximum divergence of surface and intermediate water dwellers in the Eastern Pacific and the Caribbean Sea as a criterion other researchers placed the final and permanent interruption of the connection from the Atlantic to Pacific between 2.4 to 1.8 Ma ( et alii,
1989; et alii, 1995; ,
2002).
). The date of the final closure of the
Central American Seaway is somewhat controversial ( et alii,
1998): In older literature it is reported to have occurred during the Early Pliocene between 3.5 to 3.1 Ma (,
1976; , 1978; ,
1990). According to &
(2007) and references therein, complete closure of the Central American Seaway occurred between 4.2 and 3.5 Ma, with occasional breaches of the isthmian barrier until 2.88 Ma to 2.76 Ma. Analysis of calcareous nannoplankton by &
(2000) demonstrated final closure to be to have occurred after 2.76 Ma. Using the maximum divergence of surface and intermediate water dwellers in the Eastern Pacific and the Caribbean Sea as a criterion other researchers placed the final and permanent interruption of the connection from the Atlantic to Pacific between 2.4 to 1.8 Ma ( et alii,
1989; et alii, 1995; ,
2002).
![]() The emergence of the Isthmus of Panama had a profound influence: It effected a differentiation of watermasses, caused a reorganization of surface water current systems on both sides of Central America, and resulted in the development of the modern Atlantic-Pacific asymmetry in water chemistry and hydrology (, , et alii, 2003). Today, there is a strong contrast in the salinity of Atlantic/Caribbean surface waters and those of the eastern equatorial Pacific. In particular tropical heat and northeasterly tradewinds lead to strong evaporation, an increase in salinity and the development of stratification in modern Caribbean sea-surface waters. Over the Central American Cordilleras the transported vapor precipitates and the increased rainfall and runoff o the east reduces salinity in the surface waters of the Panama Basin. During the Pliocene�Pleistocene the difference in the salinity of the Atlantic and Pacific oceans became gradually more pronounced as the closure of the ancient sea connection progressed. These changes in environment and the isolation of faunas caused by the emergence of the Isthmus of Panama caused provincialism to develop among planktic and benthic foraminifera and other marine biota in the coastal and off-shore areas of both the Caribbean Sea and the eastern equatorial Pacific (,
1966; , 1976; ,
1976; & ,
1985; et alii,
1992; et alii,
1996).
The emergence of the Isthmus of Panama had a profound influence: It effected a differentiation of watermasses, caused a reorganization of surface water current systems on both sides of Central America, and resulted in the development of the modern Atlantic-Pacific asymmetry in water chemistry and hydrology (, , et alii, 2003). Today, there is a strong contrast in the salinity of Atlantic/Caribbean surface waters and those of the eastern equatorial Pacific. In particular tropical heat and northeasterly tradewinds lead to strong evaporation, an increase in salinity and the development of stratification in modern Caribbean sea-surface waters. Over the Central American Cordilleras the transported vapor precipitates and the increased rainfall and runoff o the east reduces salinity in the surface waters of the Panama Basin. During the Pliocene�Pleistocene the difference in the salinity of the Atlantic and Pacific oceans became gradually more pronounced as the closure of the ancient sea connection progressed. These changes in environment and the isolation of faunas caused by the emergence of the Isthmus of Panama caused provincialism to develop among planktic and benthic foraminifera and other marine biota in the coastal and off-shore areas of both the Caribbean Sea and the eastern equatorial Pacific (,
1966; , 1976; ,
1976; & ,
1985; et alii,
1992; et alii,
1996).
![]() Caribbean DSDP Site 502A (Colombia Basin, 11° 29.46' N/79° 22.74' W, water depth 3052m) and Eastern Equatorial Pacific DSDP Site 503A (Guatemala Basin, 4° 04.04' N/ 95° 38.21'W, water depth 3672m, see
Fig. 1
Caribbean DSDP Site 502A (Colombia Basin, 11° 29.46' N/79° 22.74' W, water depth 3052m) and Eastern Equatorial Pacific DSDP Site 503A (Guatemala Basin, 4° 04.04' N/ 95° 38.21'W, water depth 3672m, see
Fig. 1 ![]() ) were selected because of their locations on either side of the Isthmus of Panama, core recovery of calcareous microfossils was almost continuous and the availability for these sites of detailed biostratigraphic, palaeoceanographic and palaeoecological studies (,
1982; , 1982; et alii,
1989; , 1996). Sixty-two samples (each 20cc of bulk sediment) were investigated (i.e. 38 samples from DSDP Sites 502 and 502A and 24 samples from DSDP Sites 503 and 503A, all obtained from the core repositories of the Ocean Drilling Program. A few samples from these sites were also selected from subsplits of the collections of the West-European Micropalaeontological Reference Center (MRC) of the DSDP and ODP, that are held in Basel. Using kerosene, all samples were wet sieved through standard screens into size fractions of less than 63µm, 63-100µm, 100-500µm, and 500-1000µm, and then oven dried at 80°C. Only the two larger size fractions were used for this analysis.
) were selected because of their locations on either side of the Isthmus of Panama, core recovery of calcareous microfossils was almost continuous and the availability for these sites of detailed biostratigraphic, palaeoceanographic and palaeoecological studies (,
1982; , 1982; et alii,
1989; , 1996). Sixty-two samples (each 20cc of bulk sediment) were investigated (i.e. 38 samples from DSDP Sites 502 and 502A and 24 samples from DSDP Sites 503 and 503A, all obtained from the core repositories of the Ocean Drilling Program. A few samples from these sites were also selected from subsplits of the collections of the West-European Micropalaeontological Reference Center (MRC) of the DSDP and ODP, that are held in Basel. Using kerosene, all samples were wet sieved through standard screens into size fractions of less than 63µm, 63-100µm, 100-500µm, and 500-1000µm, and then oven dried at 80°C. Only the two larger size fractions were used for this analysis.
![]() With a microsplitter, the residues of the size fractions 100-500µm and 500-1000µm were divided up into aliquots of 1/2, 1/4, 1/8, 1/16, 1/32 or 1/64 depending on the amount of material available. Thereafter, all menardiform specimens in a selected split were handpicked under the binocular microscope. The goal was to obtain 50 specimens per split and size fraction whenever possible. At Site 502A four samples of Pleistocene age contained no menardiform globorotalias.
With a microsplitter, the residues of the size fractions 100-500µm and 500-1000µm were divided up into aliquots of 1/2, 1/4, 1/8, 1/16, 1/32 or 1/64 depending on the amount of material available. Thereafter, all menardiform specimens in a selected split were handpicked under the binocular microscope. The goal was to obtain 50 specimens per split and size fraction whenever possible. At Site 502A four samples of Pleistocene age contained no menardiform globorotalias.
![]() The stratigraphy and foraminiferal composition of Sites 502A and 503A were investigated by
(1982). Models of numerical age for sites 502 and 503 were constructed using the available data for planktic foraminifera (,
1982), radiolarians ( & ,
1982), diatoms (, 1982), coccoliths (,
1982), supplemented by magnetostratigraphy ( & ,
1982), and core-depth information ( & et alii,
1982). All ages accord with the integrated biogeochronology of et alii (1995) and were obtained by conversion of the published biogeochronological datums to the magnetic polarity timescale of &
(1995).
The stratigraphy and foraminiferal composition of Sites 502A and 503A were investigated by
(1982). Models of numerical age for sites 502 and 503 were constructed using the available data for planktic foraminifera (,
1982), radiolarians ( & ,
1982), diatoms (, 1982), coccoliths (,
1982), supplemented by magnetostratigraphy ( & ,
1982), and core-depth information ( & et alii,
1982). All ages accord with the integrated biogeochronology of et alii (1995) and were obtained by conversion of the published biogeochronological datums to the magnetic polarity timescale of &
(1995).
![]() These models of numerical age were built with an updated version of the Age-Depth Plot (ADP) Program from
(1992). The control points of age-depth curves used for numerical age determinations are indicated in
Table 1
These models of numerical age were built with an updated version of the Age-Depth Plot (ADP) Program from
(1992). The control points of age-depth curves used for numerical age determinations are indicated in
Table 1 ![]() , and the curves are shown in
Fig. 4
, and the curves are shown in
Fig. 4 ![]() . The age in years of a sample was calculated by linear interpolation between control points, using the AgeMaker Program (AM) from
(1992).
. The age in years of a sample was calculated by linear interpolation between control points, using the AgeMaker Program (AM) from
(1992).
![]() Whenever possible, samples were taken at isochronous levels at both sites. If limited quantities or poor preservation of menardiform globorotalias prevented this match in timing, the nearest usable sample was chosen. The stratigraphic positions and ages of the samples are summarized in
Table 2
Whenever possible, samples were taken at isochronous levels at both sites. If limited quantities or poor preservation of menardiform globorotalias prevented this match in timing, the nearest usable sample was chosen. The stratigraphic positions and ages of the samples are summarized in
Table 2 ![]() .
.
![]() Individuals of Globorotalia menardii and related species were mounted in keel position on multisquared faunal slides. In keel position the shell stands upright on the keel with the spire side to the left and the primary aperture facing upward (see the specimens pictured in Figs. 2, 5 and 8 of
Plate 1
Individuals of Globorotalia menardii and related species were mounted in keel position on multisquared faunal slides. In keel position the shell stands upright on the keel with the spire side to the left and the primary aperture facing upward (see the specimens pictured in Figs. 2, 5 and 8 of
Plate 1 ![]() ). Specimens were imaged in keel position using a Kappa CF 11/2 digital video camera connected to a Macintosh computer and attached to a Leica MZ 6 binocular microscope. Using a hemispherical stage each specimen was rotated into a standard position with respect to a virtual coordinate system on the imaging
window. In practice, the optimum keel position was attained when the area of the keel view was judged visually to be minimal. The specimens were then rotated until the long axis of their peripheral outline was vertical. The rotated specimen was then moved horizontally until the apex of the spire was contiguous to a y-coordinate of 240 pixels in the 640x480 pixel image on the computer monitor
(Fig. 5
). Specimens were imaged in keel position using a Kappa CF 11/2 digital video camera connected to a Macintosh computer and attached to a Leica MZ 6 binocular microscope. Using a hemispherical stage each specimen was rotated into a standard position with respect to a virtual coordinate system on the imaging
window. In practice, the optimum keel position was attained when the area of the keel view was judged visually to be minimal. The specimens were then rotated until the long axis of their peripheral outline was vertical. The rotated specimen was then moved horizontally until the apex of the spire was contiguous to a y-coordinate of 240 pixels in the 640x480 pixel image on the computer monitor
(Fig. 5 ![]() ). This positioning was necessary because it allowed calculation of Fourier components without a rotational bias. Grey-level images (256 grey-levels) with a resolution of 640x480 pixels were then taken using Wayne 's Nih-Image 1.6.0 software. NIH-Image is in the public domain and can be downloaded from the National Institute of Mental Health at
http://rsb.info.nih.gov/nih-image/.
). This positioning was necessary because it allowed calculation of Fourier components without a rotational bias. Grey-level images (256 grey-levels) with a resolution of 640x480 pixels were then taken using Wayne 's Nih-Image 1.6.0 software. NIH-Image is in the public domain and can be downloaded from the National Institute of Mental Health at
http://rsb.info.nih.gov/nih-image/.
![]() Grey-level images were converted into binary black and white pictures using standard LUT transformations in Nih-Image or Adobe Photoshop. On the black and white images extraction of their outline was done, using the Fortran program Trace33_batch.out, written by the author (,
1998), and calibrated with a 0.01 mm scale. Trace33_batch.out determines the cartesian x,y coordinates of the outline in micrometers from a suite of digital images in batch mode, and allows correction for the several magnifications used by the microscopist.
Grey-level images were converted into binary black and white pictures using standard LUT transformations in Nih-Image or Adobe Photoshop. On the black and white images extraction of their outline was done, using the Fortran program Trace33_batch.out, written by the author (,
1998), and calibrated with a 0.01 mm scale. Trace33_batch.out determines the cartesian x,y coordinates of the outline in micrometers from a suite of digital images in batch mode, and allows correction for the several magnifications used by the microscopist.
![]() The microscope is equipped with a 1.0x achromatic objective and a 0.63-4.0x zoom body. Measurements were taken at zooms ranging between 4x and 2x, which translates into a measurement resolution of 2.09 ± 0.007 µm per pixel to 4.23 ± 0.05 µm per pixel (at 2x).
The microscope is equipped with a 1.0x achromatic objective and a 0.63-4.0x zoom body. Measurements were taken at zooms ranging between 4x and 2x, which translates into a measurement resolution of 2.09 ± 0.007 µm per pixel to 4.23 ± 0.05 µm per pixel (at 2x).
![]() Accurate and consistent manual positioning of the specimens during imaging is a major challenge for the operator and always introduces variation in the measurements. The precision of repeatability is contingent on positioning the specimens at the same orientation and tilt angle, and moving them to the same virtual coordinate system on the monitor. A second source for inexactness in outline repeatability is the lack of consistency in the application of LUT operations, i.e. when grey-level images are transformed to binary black and white images processing is degraded by fluctuations in illumination, the existence of background reflections and changes of the signal to noise ratio of the original image. In order to estimate the repeatability
(sensu & ,
1998) of the measurements, one specimen was imaged 30 times and processed using the same method and the same equipment throughout, so the coordinates of the outline and the morphometric parameters derived therefrom were obtained under identical conditions. For the spiral height (∂x) and axial diameter (∂y) of the shell standard deviations of 1.2µm and 4.7µm were estimated that is 0.2% and 0.4% of the mean ∂x and mean ∂y. To make an estimate of the absolute range of error due to manual positioning, the 250 rays of each of the 30 interpolated outlines were transformed into polar coordinates (ρ,θ) and the variations in ray length (ρ) due to manual repositioning were analyzed at each angle θ (with increments of Δθ = 360°/250=1.44°). The average of the absolute differences between maximum and minimum ray-length for the rays derived from the 30 measurements of this experiment is 18.26 µm (,
2007, unpublished), which is 1.6% of the length of the test in keel view (for this specimen ∂y =1117 µm). These results demonstrate that error in measurement due to the procedures of orientation is negligible in relation to the overall ranges of test size of specimens from samples at of various ages and discrete stratigraphic levels.
Accurate and consistent manual positioning of the specimens during imaging is a major challenge for the operator and always introduces variation in the measurements. The precision of repeatability is contingent on positioning the specimens at the same orientation and tilt angle, and moving them to the same virtual coordinate system on the monitor. A second source for inexactness in outline repeatability is the lack of consistency in the application of LUT operations, i.e. when grey-level images are transformed to binary black and white images processing is degraded by fluctuations in illumination, the existence of background reflections and changes of the signal to noise ratio of the original image. In order to estimate the repeatability
(sensu & ,
1998) of the measurements, one specimen was imaged 30 times and processed using the same method and the same equipment throughout, so the coordinates of the outline and the morphometric parameters derived therefrom were obtained under identical conditions. For the spiral height (∂x) and axial diameter (∂y) of the shell standard deviations of 1.2µm and 4.7µm were estimated that is 0.2% and 0.4% of the mean ∂x and mean ∂y. To make an estimate of the absolute range of error due to manual positioning, the 250 rays of each of the 30 interpolated outlines were transformed into polar coordinates (ρ,θ) and the variations in ray length (ρ) due to manual repositioning were analyzed at each angle θ (with increments of Δθ = 360°/250=1.44°). The average of the absolute differences between maximum and minimum ray-length for the rays derived from the 30 measurements of this experiment is 18.26 µm (,
2007, unpublished), which is 1.6% of the length of the test in keel view (for this specimen ∂y =1117 µm). These results demonstrate that error in measurement due to the procedures of orientation is negligible in relation to the overall ranges of test size of specimens from samples at of various ages and discrete stratigraphic levels.
![]() A suite of Fortran 77 programs for Macintosh were written by the author (,
2004) in order to extract semi-automatically morphological parameters of the test from coordinates defining its outline and from them to calculate statistics regarding speciation. Variables used here include ∂x (spiral height, in µm), ∂y (axial diameter, i.e. longest axis in keel view, in µm), Ar (surface area in keel view, in mm2), and the upper keel angle (Φ1, in degrees, see
Fig. 5
A suite of Fortran 77 programs for Macintosh were written by the author (,
2004) in order to extract semi-automatically morphological parameters of the test from coordinates defining its outline and from them to calculate statistics regarding speciation. Variables used here include ∂x (spiral height, in µm), ∂y (axial diameter, i.e. longest axis in keel view, in µm), Ar (surface area in keel view, in mm2), and the upper keel angle (Φ1, in degrees, see
Fig. 5 ![]() ).
).
![]() Software to calculate these variables includes Fortran 77 and the programs Sprep53.out and KeelWidth93.out. For the calculation of means and the 95% confidence intervals around the means, the programs Compose31.out, Stat_Prep21.out and Stats62.out were used. For the preparation of bivariate frequency diagrams of ∂x and ∂y the program Grid1.2.out was employed (all programs are documented in ,
2004). This working scheme is summarized in
Figure 6
Software to calculate these variables includes Fortran 77 and the programs Sprep53.out and KeelWidth93.out. For the calculation of means and the 95% confidence intervals around the means, the programs Compose31.out, Stat_Prep21.out and Stats62.out were used. For the preparation of bivariate frequency diagrams of ∂x and ∂y the program Grid1.2.out was employed (all programs are documented in ,
2004). This working scheme is summarized in
Figure 6 ![]() .
.
![]() Particle size distributions of the 100-500µm and 500-1000µm size fractions were sometimes quite unequal, with a predominance of small menardiform globorotalias in the smaller size fraction and rare large specimens in the larger one. Due to the great number of individuals in the smaller size fraction it was not always possible to pick all of the specimens, while in the larger-size fraction all of them could be picked. The smaller size fractions were split and the consequent disparity in sampling was compensated for using program Stat_Prep21.out prior to statistical calculations. This program takes into account the degree of splitting and number of picked specimens in each size fraction (Example: Only one specimen was present in the entire split of 500-1000µm, and 100 specimens were found in the 1/4 split of the 100-500µm size fraction. In this case each variable from the 100-500µm size fraction was weighted by a factor of 4, i.e. the reciprocal of the number of splitting operations. Of the 500-1000µm size fraction in this example the weighting factor is one). Samples so treated are labelled with an asterisk in
Table 2
Particle size distributions of the 100-500µm and 500-1000µm size fractions were sometimes quite unequal, with a predominance of small menardiform globorotalias in the smaller size fraction and rare large specimens in the larger one. Due to the great number of individuals in the smaller size fraction it was not always possible to pick all of the specimens, while in the larger-size fraction all of them could be picked. The smaller size fractions were split and the consequent disparity in sampling was compensated for using program Stat_Prep21.out prior to statistical calculations. This program takes into account the degree of splitting and number of picked specimens in each size fraction (Example: Only one specimen was present in the entire split of 500-1000µm, and 100 specimens were found in the 1/4 split of the 100-500µm size fraction. In this case each variable from the 100-500µm size fraction was weighted by a factor of 4, i.e. the reciprocal of the number of splitting operations. Of the 500-1000µm size fraction in this example the weighting factor is one). Samples so treated are labelled with an asterisk in
Table 2 ![]() and are set apart by the apostrophe of n' in the bivariate frequency plots (e.g.
Fig. 7
and are set apart by the apostrophe of n' in the bivariate frequency plots (e.g.
Fig. 7 ![]() ). If subsplits of the two size fractions contain similar numbers of menardiform globorotalids they were picked quantitatively and no corrections were necessary.
). If subsplits of the two size fractions contain similar numbers of menardiform globorotalids they were picked quantitatively and no corrections were necessary.
![]() All samples, slides, digital images (Tiff files, raw files), morphometric data and morphometric software are deposited in the Natural History Museum at Basel.
All samples, slides, digital images (Tiff files, raw files), morphometric data and morphometric software are deposited in the Natural History Museum at Basel.
![]() Globorotalia menardii menardii, G. menardii cultrata, G. limbata and G. multicamerata constitute the Miocene to Recent, tropical to subtropical plexus of menardiform globorotalias. The genus Globorotalia
(1927) is characterized by a low-trochospiral test, with a primary apertural opening on the ventral side in an umbilical extra-umbilical position (,
1979). The menardiform globorotalias, for which
(1972) coined a new subgenus Menardella, represents the original Globorotalia sensu stricto of
(1979). These forms are non-spinose, with a smooth and densely perforate test and have a pronounced imperforate carina, which circumscribes the periphery of the test. In the Neogene these taxa include G. archaeomenardii, G. praemenardii, Globorotalia menardii menardii and G. menardii cultrata, G. fimbriata, G. limbata, G. multicamerata, G. pertenuis, and G. exilis. Depending on the author, they also include G. pseudomiocenica and G. miocenica and the series of G. tumida.
Globorotalia menardii menardii, G. menardii cultrata, G. limbata and G. multicamerata constitute the Miocene to Recent, tropical to subtropical plexus of menardiform globorotalias. The genus Globorotalia
(1927) is characterized by a low-trochospiral test, with a primary apertural opening on the ventral side in an umbilical extra-umbilical position (,
1979). The menardiform globorotalias, for which
(1972) coined a new subgenus Menardella, represents the original Globorotalia sensu stricto of
(1979). These forms are non-spinose, with a smooth and densely perforate test and have a pronounced imperforate carina, which circumscribes the periphery of the test. In the Neogene these taxa include G. archaeomenardii, G. praemenardii, Globorotalia menardii menardii and G. menardii cultrata, G. fimbriata, G. limbata, G. multicamerata, G. pertenuis, and G. exilis. Depending on the author, they also include G. pseudomiocenica and G. miocenica and the series of G. tumida.
![]() The identification of the species of menardiform globorotalids is determined through the degree of inflation of the shell, the degree of development of a keel, the dorsal limbation of intercameral sutures, the lobateness and roundness of the shell in equatorial view, the relative size of the umbilicus, and the number of chambers per whorl. The term limbation is used here in the sense of
(1979) to describe "the continuation of the carina over the anterior face of a chamber successive additions of new
chambers" (cit. Text Part I and Part II, Section 1,
p. 389).
The identification of the species of menardiform globorotalids is determined through the degree of inflation of the shell, the degree of development of a keel, the dorsal limbation of intercameral sutures, the lobateness and roundness of the shell in equatorial view, the relative size of the umbilicus, and the number of chambers per whorl. The term limbation is used here in the sense of
(1979) to describe "the continuation of the carina over the anterior face of a chamber successive additions of new
chambers" (cit. Text Part I and Part II, Section 1,
p. 389).
![]() While the taxonomic literature is in agreement concerning the general application of these characters for identification, there has been considerable controversy about menardiform nomenclature. Particularly the distinction between the two extant forms, G. menardii menardii and G. menardii cultrata, gave rise to much debate ( et alii,
1975, 1978), and the relationship of these extant forms to the morphologically similar but extinct Pliocene offshoots G. limbata
(1902) and G. multicamerata &
(1930) gave rise to discussion.
While the taxonomic literature is in agreement concerning the general application of these characters for identification, there has been considerable controversy about menardiform nomenclature. Particularly the distinction between the two extant forms, G. menardii menardii and G. menardii cultrata, gave rise to much debate ( et alii,
1975, 1978), and the relationship of these extant forms to the morphologically similar but extinct Pliocene offshoots G. limbata
(1902) and G. multicamerata &
(1930) gave rise to discussion.
![]() The name Rotalia menardii was introduced by d' (1826) for a specimen from modern beach sands at Rimini. It was later recognized as having been reworked from nearby Tortonian exposures. Thereafter G. menardii was redefined several times on the basis of specimens from various provenances: The first valid indications for a description of G. menardii was published by , &
(1865) on the basis of a drawing of d''s model No. 10, which, however is not accepted by the ICZN. These authors had available a collection of H.B.
and his brother G.S. , who collected a "syntypic" series of specimens from Recent sediments on the Isle of Man (Irish Sea). In
1960, & from these syntypes designated one specimen as the lectotype of Globorotalia menardii (, & ). However, it is obvious that these specimens too must be reworked because of their non-tropical provenance, so a valid lectotype for this species remains under question. The same authors designated a neotype for Globorotalia cultrata, a form that d' described in
1839 from the modern sands of Cuba, Martinique, Guadeloupe, and Jamaica. These emendations led to controversial discussions as to whether or not G. menardii and G. cultrata are synonymous. For example,
(1970) and (1979), advocated the erection of two extant subspecies G. menardii cultrata and G. menardii menardii, while others ( &
(1983) and et alii
(1978) and references cited therein) did not agree. In order to set up a valid nomenclature et alii
(1978) suggested a neotype for G. menardii from stratigraphically well-defined Tortonian strata in the Senigallia section near Rimini. Their proposal was accepted by the ICZN ( & ,
1987: cit. section III, specific names,
p. 258). Yet, in the literature the usage of Globorotalia menardii and G. cultrata is still diverse.
The name Rotalia menardii was introduced by d' (1826) for a specimen from modern beach sands at Rimini. It was later recognized as having been reworked from nearby Tortonian exposures. Thereafter G. menardii was redefined several times on the basis of specimens from various provenances: The first valid indications for a description of G. menardii was published by , &
(1865) on the basis of a drawing of d''s model No. 10, which, however is not accepted by the ICZN. These authors had available a collection of H.B.
and his brother G.S. , who collected a "syntypic" series of specimens from Recent sediments on the Isle of Man (Irish Sea). In
1960, & from these syntypes designated one specimen as the lectotype of Globorotalia menardii (, & ). However, it is obvious that these specimens too must be reworked because of their non-tropical provenance, so a valid lectotype for this species remains under question. The same authors designated a neotype for Globorotalia cultrata, a form that d' described in
1839 from the modern sands of Cuba, Martinique, Guadeloupe, and Jamaica. These emendations led to controversial discussions as to whether or not G. menardii and G. cultrata are synonymous. For example,
(1970) and (1979), advocated the erection of two extant subspecies G. menardii cultrata and G. menardii menardii, while others ( &
(1983) and et alii
(1978) and references cited therein) did not agree. In order to set up a valid nomenclature et alii
(1978) suggested a neotype for G. menardii from stratigraphically well-defined Tortonian strata in the Senigallia section near Rimini. Their proposal was accepted by the ICZN ( & ,
1987: cit. section III, specific names,
p. 258). Yet, in the literature the usage of Globorotalia menardii and G. cultrata is still diverse.
![]() To complicate the situation further
(1970) introduced two extinct (Late Miocene to Early Pliocene) variants of G. menardii, i.e. G. menardii 'A' (small tests) and G. menardii 'B' (larger tests). The relationship between G. menardii 'A' and G. menardii 'B' and the extant representatives of G. menardii (which develop an even larger range of sizes) has until now not been clarified. According to &
(1985) G. menardii 'B' is a transitional form leading to Globorotalia multicamerata, a very distinctive but extinct (Pliocene) stratigraphic marker. On the other hand, G. menardii 'B' is morphologically very similar to G. limbata, a form introduced earlier by
(1902), but unfortunately it too was collected from reworked sediments at Rimini ( &
(1972),
p. 55).
To complicate the situation further
(1970) introduced two extinct (Late Miocene to Early Pliocene) variants of G. menardii, i.e. G. menardii 'A' (small tests) and G. menardii 'B' (larger tests). The relationship between G. menardii 'A' and G. menardii 'B' and the extant representatives of G. menardii (which develop an even larger range of sizes) has until now not been clarified. According to &
(1985) G. menardii 'B' is a transitional form leading to Globorotalia multicamerata, a very distinctive but extinct (Pliocene) stratigraphic marker. On the other hand, G. menardii 'B' is morphologically very similar to G. limbata, a form introduced earlier by
(1902), but unfortunately it too was collected from reworked sediments at Rimini ( &
(1972),
p. 55).
![]() In summary, resolving these taxonomic and phylogenetic difficulties requires more detailed investigation, one of the objectives of the present study. As a working hypothesis the nomenclatural concepts of &
(1985) are followed here, with, however, the following modifications: The extinct Globorotalia menardii 'A'
(1970) is included in the plexus of G. menardii menardii. This usage is based on the morphometric data given below and is in accordance with the observations of
(1979) and
(1970). Also, it is reasonable to consider G. menardii 'B'
(1970) as a junior synonym of G. limbata
(1902), an attribution supported by morphometric data.
In summary, resolving these taxonomic and phylogenetic difficulties requires more detailed investigation, one of the objectives of the present study. As a working hypothesis the nomenclatural concepts of &
(1985) are followed here, with, however, the following modifications: The extinct Globorotalia menardii 'A'
(1970) is included in the plexus of G. menardii menardii. This usage is based on the morphometric data given below and is in accordance with the observations of
(1979) and
(1970). Also, it is reasonable to consider G. menardii 'B'
(1970) as a junior synonym of G. limbata
(1902), an attribution supported by morphometric data.
![]() This study focuses on the morphological evolution of G. menardii during the past 8 million years and on the Pliocene lineage G. menardii - G. limbata - G. multicamerata. The analysis is based on 4400 specimens.
This study focuses on the morphological evolution of G. menardii during the past 8 million years and on the Pliocene lineage G. menardii - G. limbata - G. multicamerata. The analysis is based on 4400 specimens.
![]() This total comprises 2627 specimens of G. menardii from Site 502A and 1410 specimens from Site 503A, as well as the extinct G. limbata - G. multicamerata lineage of which there are 252 specimens from Site 502A and 111 specimens from Site 503A.
This total comprises 2627 specimens of G. menardii from Site 502A and 1410 specimens from Site 503A, as well as the extinct G. limbata - G. multicamerata lineage of which there are 252 specimens from Site 502A and 111 specimens from Site 503A.
![]() All menardiform specimens selected from an assemblage were first measured randomly without segregation into taxonomic groups. They were then classified by morphotype using the characters described below. Only after these preliminary steps were morphotypes tentatively assigned species by visual comparison with the figures and plates in the literature.
All menardiform specimens selected from an assemblage were first measured randomly without segregation into taxonomic groups. They were then classified by morphotype using the characters described below. Only after these preliminary steps were morphotypes tentatively assigned species by visual comparison with the figures and plates in the literature.
![]() Investigations regarding the dimensions and surface area of the tests in spire, umbilical and side views have
shown that variation in size is more easily measured in keel view than in umbilical or spire views, although a good correlation exists in the relationships of the several aspects. Therefore, variation of spire height (∂x) versus axial diameter (∂y) was analyzed in a series of bivariate frequency plots. They demonstrate the change in size of tests better than scatter plots of of the same variables. The steps involved in constructing these frequency plots were: First, a sorting per sample and per species of the ∂x and ∂y values using grid-cells of 50µm bin width in the ∂x direction (=Δ∂x) and 100 µm in the ∂y direction (=Δ∂y). The most useful binning intervals of Δ∂x and Δ∂y were found by experiment. Second, selection of the narrowest bin-width yielding the frequency distribution with the most robust mode. This, as indicated above, was found at 50µm and 100µm. Third, the number of specimens per grid cell was counted using the program Grid 1.2 (see
Fig. 6
Investigations regarding the dimensions and surface area of the tests in spire, umbilical and side views have
shown that variation in size is more easily measured in keel view than in umbilical or spire views, although a good correlation exists in the relationships of the several aspects. Therefore, variation of spire height (∂x) versus axial diameter (∂y) was analyzed in a series of bivariate frequency plots. They demonstrate the change in size of tests better than scatter plots of of the same variables. The steps involved in constructing these frequency plots were: First, a sorting per sample and per species of the ∂x and ∂y values using grid-cells of 50µm bin width in the ∂x direction (=Δ∂x) and 100 µm in the ∂y direction (=Δ∂y). The most useful binning intervals of Δ∂x and Δ∂y were found by experiment. Second, selection of the narrowest bin-width yielding the frequency distribution with the most robust mode. This, as indicated above, was found at 50µm and 100µm. Third, the number of specimens per grid cell was counted using the program Grid 1.2 (see
Fig. 6 ![]() ). Fourth, the frequency distributions were contoured and plotted using Surface III 2.6 plus software from the Kansas Geological Survey. The results of the many discrete samples treated in this way are shown in
Figure 7
). Fourth, the frequency distributions were contoured and plotted using Surface III 2.6 plus software from the Kansas Geological Survey. The results of the many discrete samples treated in this way are shown in
Figure 7 ![]() (Caribbean Sea Site 502a) and Figure 8
(Caribbean Sea Site 502a) and Figure 8 ![]() (eastern equatorial Pacific Site 503A).
(eastern equatorial Pacific Site 503A).
![]() At both sites the plots show a clear increase in size during the past 8 million years. At DSDP Sites 502A and 503A and from about 8 Ma (Late Miocene) until 0.23 Ma (Late Pleistocene) G. menardii follows a continuous, time-progressive morphocline in the space of ∂x versus ∂y with a rather constant ratio of ∂x/∂y. For specimens conforming with this trend the informal designation morphotype alpha is suggested. In sediments younger than 0.22 Ma a second group appeared with tests consistently less inflated than those of morphotype alpha. These tests are informally designated as morphotype beta. In the ∂x vs ∂y morphospace the two morphotypes are best separated by a line generated by the equation ∂y = 3.2 * ∂x - 160 (∂x and ∂y in units of µm). This proxy of a line of regression was selected by visual inspection on the basis of minimum overlap of the contoured frequency distributions. Specimens of morphotype alpha are below that line and specimens of morphotype beta are above it. A significant shift from morphotype alpha to morphotype beta takes place between 0.22 Ma and 0.14 Ma in the Caribbean Sea Site 502A (see
Fig. 7
At both sites the plots show a clear increase in size during the past 8 million years. At DSDP Sites 502A and 503A and from about 8 Ma (Late Miocene) until 0.23 Ma (Late Pleistocene) G. menardii follows a continuous, time-progressive morphocline in the space of ∂x versus ∂y with a rather constant ratio of ∂x/∂y. For specimens conforming with this trend the informal designation morphotype alpha is suggested. In sediments younger than 0.22 Ma a second group appeared with tests consistently less inflated than those of morphotype alpha. These tests are informally designated as morphotype beta. In the ∂x vs ∂y morphospace the two morphotypes are best separated by a line generated by the equation ∂y = 3.2 * ∂x - 160 (∂x and ∂y in units of µm). This proxy of a line of regression was selected by visual inspection on the basis of minimum overlap of the contoured frequency distributions. Specimens of morphotype alpha are below that line and specimens of morphotype beta are above it. A significant shift from morphotype alpha to morphotype beta takes place between 0.22 Ma and 0.14 Ma in the Caribbean Sea Site 502A (see
Fig. 7 ![]() ). At the Eastern Equatorial Pacific Site the more robust and more inflated morphotype alpha (below the line of separation) prevails
(Fig. 8
). At the Eastern Equatorial Pacific Site the more robust and more inflated morphotype alpha (below the line of separation) prevails
(Fig. 8 ![]() ). The latest sample shows a strong admixture of inflated morphotype beta with those of morphotype alpha. This broadened the ∂x versus ∂y frequency distribution. To illustrate the differences between these morphotypes more strikingly, additional cumulative bivariate frequency diagrams were produced for each site showing the morphospaces of ∂x versus ∂y for assemblages older versus those younger than 0.22 Ma
(Fig. 9
). The latest sample shows a strong admixture of inflated morphotype beta with those of morphotype alpha. This broadened the ∂x versus ∂y frequency distribution. To illustrate the differences between these morphotypes more strikingly, additional cumulative bivariate frequency diagrams were produced for each site showing the morphospaces of ∂x versus ∂y for assemblages older versus those younger than 0.22 Ma
(Fig. 9 ![]() ).
).
![]() The evolution of test size during the past 8 million years of morphotypes alpha and beta can also be seen in specimens from DSDP Sites 502A and 503A, when the area enclosed by the test outline in keel view is measured. This is shown in
Figures 10
The evolution of test size during the past 8 million years of morphotypes alpha and beta can also be seen in specimens from DSDP Sites 502A and 503A, when the area enclosed by the test outline in keel view is measured. This is shown in
Figures 10 ![]() and 11
and 11 ![]() . At the Caribbean site the mean values of keel view area show only a little net change from 7.1 Ma (Late Miocene) to 2.58 Ma (Late Pliocene,
Fig. 10
. At the Caribbean site the mean values of keel view area show only a little net change from 7.1 Ma (Late Miocene) to 2.58 Ma (Late Pliocene,
Fig. 10 ![]() ). At this site samples were barren in G. menardii between 2.58 Ma and 1.7 Ma, and after the final closure of the isthmus (1.8 Ma) the keel view area of morphotypes tended to be larger by at least 50%. Also the maximum sizes of the assemblages show a rather static pattern from the Late Miocene to Early-Mid Pliocene. However, after the barren interval between 2.58-1.7 Ma (i.e. post closure), the maxima of test size shifted rapidly towards larger values. In contrast, minimum surface areas showed no directional pattern. This behaviour is also reflected in a progressive expansion of morphotype alpha in the ∂x versus ∂y contour diagrams of
Figure 7
). At this site samples were barren in G. menardii between 2.58 Ma and 1.7 Ma, and after the final closure of the isthmus (1.8 Ma) the keel view area of morphotypes tended to be larger by at least 50%. Also the maximum sizes of the assemblages show a rather static pattern from the Late Miocene to Early-Mid Pliocene. However, after the barren interval between 2.58-1.7 Ma (i.e. post closure), the maxima of test size shifted rapidly towards larger values. In contrast, minimum surface areas showed no directional pattern. This behaviour is also reflected in a progressive expansion of morphotype alpha in the ∂x versus ∂y contour diagrams of
Figure 7 ![]() from 3.11 Ma to 1.7 Ma (the samples at 2.88 Ma and 2.58 Ma contained very few specimens of G. menardii).
from 3.11 Ma to 1.7 Ma (the samples at 2.88 Ma and 2.58 Ma contained very few specimens of G. menardii).
![]() On the Pacific side, the morphological changes are distinctly different, i.e. they show a more gradual increase in both mean keel view area and the maxima of test size throughout the past 8 million years
(Fig. 11
On the Pacific side, the morphological changes are distinctly different, i.e. they show a more gradual increase in both mean keel view area and the maxima of test size throughout the past 8 million years
(Fig. 11 ![]() ).
).
![]() Keel development. Although the adaptive advantage of having a keel is poorly understood, the development of a peripheral keel has been considered repeatedly a character useful in the study of evolution in the lineages of several planktic foraminifera (,
1969; , 1986; et alii,
1995; et alii, 1999). There are several ways to quantify geometric changes in the keel region: One is the investigation of the degree of curvature (bending, measured as the radius of the tangent circle) as one moves along the periphery of the keel. However, practical experience has shown that bending is a non-trivial geometric parameter, for the keel may display a small embayment thus offering two possible solutions. Too, the last chamber of the shell may be flexed. Sometimes this causes a false "double keel" to appear in the binary black and white image. Alternatively, the curvature of the keel can be approximated by a 2nd or higher order spline function. A spline function of an order greater than 2 provides a quite precise approximation of the outline, but has a disadvantage in that multiple minima and maxima are introduced, again leading to non-unequivocal solutions as to where precisely the keel is located. In addition, the calculation of a spline function depends on the number of outline points used to describe the keel region. So, inconsistencies are introduced when the tests differ in size.
Keel development. Although the adaptive advantage of having a keel is poorly understood, the development of a peripheral keel has been considered repeatedly a character useful in the study of evolution in the lineages of several planktic foraminifera (,
1969; , 1986; et alii,
1995; et alii, 1999). There are several ways to quantify geometric changes in the keel region: One is the investigation of the degree of curvature (bending, measured as the radius of the tangent circle) as one moves along the periphery of the keel. However, practical experience has shown that bending is a non-trivial geometric parameter, for the keel may display a small embayment thus offering two possible solutions. Too, the last chamber of the shell may be flexed. Sometimes this causes a false "double keel" to appear in the binary black and white image. Alternatively, the curvature of the keel can be approximated by a 2nd or higher order spline function. A spline function of an order greater than 2 provides a quite precise approximation of the outline, but has a disadvantage in that multiple minima and maxima are introduced, again leading to non-unequivocal solutions as to where precisely the keel is located. In addition, the calculation of a spline function depends on the number of outline points used to describe the keel region. So, inconsistencies are introduced when the tests differ in size.
![]() A method for quantifying the keel is to measure in keel position the horizontal width of the keel at a certain vertical height on the test. This approach was attempted by taking the
keel width at 10% (D10, lower keel) and at 90% (D90, upper keel) of the axial extension of the test. However, experimentation has shown that values of D10 and D90 were somewhat arbitrary as were other percentage values and were less suitable for distinguishing between morphotypes alpha and beta than a direct measure of the upper (Φ1) and lower (Φ2) angles, that embrace the keel region (see
Fig. 5
A method for quantifying the keel is to measure in keel position the horizontal width of the keel at a certain vertical height on the test. This approach was attempted by taking the
keel width at 10% (D10, lower keel) and at 90% (D90, upper keel) of the axial extension of the test. However, experimentation has shown that values of D10 and D90 were somewhat arbitrary as were other percentage values and were less suitable for distinguishing between morphotypes alpha and beta than a direct measure of the upper (Φ1) and lower (Φ2) angles, that embrace the keel region (see
Fig. 5 ![]() ). For these reasons Φ1 and Φ2 were used here to describe the nature of the keel in morphotypes of G. menardii (of course, Φ1 and Φ2 also indicate the general shape of the tests, but visual checks revealed that flat tests tend to have a very acute, thin keel and small values of Φ1 and Φ2, while more inflated tests tend to have thicker keels and larger values of Φ1 and Φ2).
Figures 12
). For these reasons Φ1 and Φ2 were used here to describe the nature of the keel in morphotypes of G. menardii (of course, Φ1 and Φ2 also indicate the general shape of the tests, but visual checks revealed that flat tests tend to have a very acute, thin keel and small values of Φ1 and Φ2, while more inflated tests tend to have thicker keels and larger values of Φ1 and Φ2).
Figures 12 ![]() and 13
and 13 ![]() illustrate the evolution of Φ1 for menardiform globorotalids at DSDP Sites 502A and 503A, respectively (the lower
value (Φ2) has a similar trend and for brevity was omitted here. During a first phase (approximately 8 Ma to 4 Ma) Φ1 showed a net tendency toward inflated tests. During the subsequent phase (approximately 4 Ma to 1 Ma) this trend reversed and the Φ1 in morphotype alpha increased slightly. During the Late Pleistocene decreasing values of Φ1 indicate the development of the flat morphotype
beta (predominantly in the Caribbean Sea).
illustrate the evolution of Φ1 for menardiform globorotalids at DSDP Sites 502A and 503A, respectively (the lower
value (Φ2) has a similar trend and for brevity was omitted here. During a first phase (approximately 8 Ma to 4 Ma) Φ1 showed a net tendency toward inflated tests. During the subsequent phase (approximately 4 Ma to 1 Ma) this trend reversed and the Φ1 in morphotype alpha increased slightly. During the Late Pleistocene decreasing values of Φ1 indicate the development of the flat morphotype
beta (predominantly in the Caribbean Sea).
![]() Morphotypes gamma and delta. During Late Miocene to Pliocene times (5.7 Ma-2.3 Ma) two now extinct morphotypes gamma and delta existed at both sites. They are distinguishable from morphotype alpha by narrower upper and lower peripheral keel angles (Φ1 and Φ2) and generally a greater number of chambers (≥ 7) in the final whorl (see
Figs. 12
Morphotypes gamma and delta. During Late Miocene to Pliocene times (5.7 Ma-2.3 Ma) two now extinct morphotypes gamma and delta existed at both sites. They are distinguishable from morphotype alpha by narrower upper and lower peripheral keel angles (Φ1 and Φ2) and generally a greater number of chambers (≥ 7) in the final whorl (see
Figs. 12 ![]() - 13
- 13 ![]() and 14
and 14 ![]() - 15
- 15 ![]() ). In the ∂x versus ∂y
morphospace, however, these forms strongly overlap morphotype alpha (Fig.
16
). In the ∂x versus ∂y
morphospace, however, these forms strongly overlap morphotype alpha (Fig.
16 ![]() ). Most specimens of morphotype alpha have 5-6, and only rarely 7 chambers in the final whorl; most examples of morphotype gamma have 7 chambers per final revolution
(Figs. 14
). Most specimens of morphotype alpha have 5-6, and only rarely 7 chambers in the final whorl; most examples of morphotype gamma have 7 chambers per final revolution
(Figs. 14 ![]() and 15
and 15 ![]() ).
Figures 12
).
Figures 12 ![]() and 13
and 13 ![]() show that morphotype gamma has consistently a narrower keel (Φ1) angle than the contemporaneous specimens of morphotype alpha. In morphotype delta the final whorl developed 8 or more chambers, and tests are even thinner, as shown by the very low values of Φ1 in comparison to those of morphotype gamma.
show that morphotype gamma has consistently a narrower keel (Φ1) angle than the contemporaneous specimens of morphotype alpha. In morphotype delta the final whorl developed 8 or more chambers, and tests are even thinner, as shown by the very low values of Φ1 in comparison to those of morphotype gamma.
![]() At the Pacific Site both gamma and delta forms evolved and existed between 5.65 � 2.95 Ma, and at the Caribbean Site are found in strata dated between 4.62 and 2.58 Ma. Like morphotype alpha the extinct morphotypes gamma and delta show a clear increase in the size of the shell test over time.
At the Pacific Site both gamma and delta forms evolved and existed between 5.65 � 2.95 Ma, and at the Caribbean Site are found in strata dated between 4.62 and 2.58 Ma. Like morphotype alpha the extinct morphotypes gamma and delta show a clear increase in the size of the shell test over time.
![]() A comparison of the proposed informal morphotypes with menardiform species illustrated in the literature ( & ,
1985; & ,
1983) leads to the following tentative assignments:
A comparison of the proposed informal morphotypes with menardiform species illustrated in the literature ( & ,
1985; & ,
1983) leads to the following tentative assignments:
![]() Morphotype alpha
(Plate 1
Morphotype alpha
(Plate 1 ![]() , Figs. 7-9;
Plate 2
, Figs. 7-9;
Plate 2 ![]() , Figs. 13-15 and 19-21) is identifiable as the Pliocene to Late Pleistocene and Holocene G. menardii menardii (, & ,
1865) as defined in &
(1985). Small specimens of morphotype alpha resemble the Middle Miocene G. menardii 'A'
(1970). Because they share a unique continuous distribution in the ∂x versus ∂y morphospace, it is reasonable to assume that G. menardii 'A' and G. menardii menardii are parts of one evolving lineage. Under these circumstances the rules of nomenclature require that Globorotalia menardii menardii (, & ,
1865) become the valid name for specimens of morphotype alpha.
, Figs. 13-15 and 19-21) is identifiable as the Pliocene to Late Pleistocene and Holocene G. menardii menardii (, & ,
1865) as defined in &
(1985). Small specimens of morphotype alpha resemble the Middle Miocene G. menardii 'A'
(1970). Because they share a unique continuous distribution in the ∂x versus ∂y morphospace, it is reasonable to assume that G. menardii 'A' and G. menardii menardii are parts of one evolving lineage. Under these circumstances the rules of nomenclature require that Globorotalia menardii menardii (, & ,
1865) become the valid name for specimens of morphotype alpha.
![]() Diagnosis: Adult or subadult test: a low trochospire, its equatorial periphery circular to oval, lobulate. Keel: prominent, often showing a sugar-like appearance. Chamber number: commonly 5 to 6 in the adult; juvenile forms have 4-5 chambers in the final whorl. Chamber sutures: on spire side curved, limbate, on umbilical side straight. Test surface: smooth, densely perforate, on umbilical side often with coarse calcification or a crust. Umbilicus: dimensions variable dependent on test size. Aperture umbilical, extra-umbilical, with development of a lip variable. Size: ranges from 200 µm to 1160µm (∂y). In the ∂x versus ∂y morphospace specimens are scattered below the separation line indicated in
Figures 7
Diagnosis: Adult or subadult test: a low trochospire, its equatorial periphery circular to oval, lobulate. Keel: prominent, often showing a sugar-like appearance. Chamber number: commonly 5 to 6 in the adult; juvenile forms have 4-5 chambers in the final whorl. Chamber sutures: on spire side curved, limbate, on umbilical side straight. Test surface: smooth, densely perforate, on umbilical side often with coarse calcification or a crust. Umbilicus: dimensions variable dependent on test size. Aperture umbilical, extra-umbilical, with development of a lip variable. Size: ranges from 200 µm to 1160µm (∂y). In the ∂x versus ∂y morphospace specimens are scattered below the separation line indicated in
Figures 7 ![]() and 8
and 8 ![]() .
.
![]() Morphotype beta
(Plate 1
Morphotype beta
(Plate 1 ![]() , Figures 4 to 6) is equivalent to Globorotalia menardii cultrata (d').
, Figures 4 to 6) is equivalent to Globorotalia menardii cultrata (d').
![]() Diagnosis: Adult test similar to that of G. menardii menardii, but with a less strongly calcified carina. The surface of the chambers is smooth and shiny, without crusting. Difference from G. menardii menardii: In the morphospace of ∂x versus ∂y G. menardii cultrata populates the field above the separation line indicated in
Figures 7
Diagnosis: Adult test similar to that of G. menardii menardii, but with a less strongly calcified carina. The surface of the chambers is smooth and shiny, without crusting. Difference from G. menardii menardii: In the morphospace of ∂x versus ∂y G. menardii cultrata populates the field above the separation line indicated in
Figures 7 ![]() and 8
and 8 ![]() . Stratigraphic distribution: During this study G. menardii cultrata was found only in samples younger than 0.22 Ma.
. Stratigraphic distribution: During this study G. menardii cultrata was found only in samples younger than 0.22 Ma.
![]() Included in the range of morphotype beta is Globorotalia fimbriata
(1884) (Plate 1
Included in the range of morphotype beta is Globorotalia fimbriata
(1884) (Plate 1 ![]() , Figs. 1 to 3). This morphological variant of G. menardii cultrata in the morphospace of ∂x versus ∂y is located above the separation line and is distinguishable from G. menardii cultrata only by the presence of small, radially arranged spines along the peripheral keel. In peripheral spines the development ranges from weak to strong. Shells of G. fimbriata were found only very rarely in Late Pleistocene-Holocene sediments.
, Figs. 1 to 3). This morphological variant of G. menardii cultrata in the morphospace of ∂x versus ∂y is located above the separation line and is distinguishable from G. menardii cultrata only by the presence of small, radially arranged spines along the peripheral keel. In peripheral spines the development ranges from weak to strong. Shells of G. fimbriata were found only very rarely in Late Pleistocene-Holocene sediments.
![]() Morphotype gamma
(Plate 2
Morphotype gamma
(Plate 2 ![]() ,
Figs. 10 to 12) is the equivalent of Globorotalia limbata
(1902) and includes Globorotalia menardii 'B' of
(1970) and Globorotalia praemiocenica &
(1972).
,
Figs. 10 to 12) is the equivalent of Globorotalia limbata
(1902) and includes Globorotalia menardii 'B' of
(1970) and Globorotalia praemiocenica &
(1972).
![]() Diagnosis: Test a low trochospiral, its equatorial periphery circular to oval, lobulate. Axial peripheral angles acute, with keel, but smaller than those of G. menardii menardii. Chamber number: In the final whorl six or seven, seven predominates. In the morphospace of ∂x versus ∂y, morphotype gamma has the same pattern of distribution as morphotype alpha, but a smaller keel angle (Φ1 < 45° at DSDP Site 502A; 30° < Φ1 < 45° at DSDP Site 503A) than morphotype alpha. G. limbata is morphologically intermediate between G. menardii menardii and G. multicamerata (as is G. menardii 'B' of
(1970), which therefore is considered a junior synonym of G. limbata).
Diagnosis: Test a low trochospiral, its equatorial periphery circular to oval, lobulate. Axial peripheral angles acute, with keel, but smaller than those of G. menardii menardii. Chamber number: In the final whorl six or seven, seven predominates. In the morphospace of ∂x versus ∂y, morphotype gamma has the same pattern of distribution as morphotype alpha, but a smaller keel angle (Φ1 < 45° at DSDP Site 502A; 30° < Φ1 < 45° at DSDP Site 503A) than morphotype alpha. G. limbata is morphologically intermediate between G. menardii menardii and G. multicamerata (as is G. menardii 'B' of
(1970), which therefore is considered a junior synonym of G. limbata).
![]() Morphotype delta is equivalent to Globorotalia multicamerata &
(1930) (Plate 2
Morphotype delta is equivalent to Globorotalia multicamerata &
(1930) (Plate 2 ![]() , Figs. 16 to 18 and 22 to 24).
, Figs. 16 to 18 and 22 to 24).
![]() Diagnosis: In the ∂x versus ∂y morphospace G. multicamerata follows a trend similar to those of G. menardii menardii and G. limbata, but has 8 or more chambers in the last whorl, which makes this form very distinctive. The keel angle Φ1 of G. multicamerata is narrower than the Φ1 values of contemporaneous specimens of G. limbata. G. multicamerata is a descendant either of G. limbata (viz & ,
1983) or of G. menardii 'B' (viz ,
1970). Here, these two forms are considered synonymous (see section "Taxonomic Concept"). At DSDP Sites 502A and 503A the morphological separation of the G. limbata - G. multicamerata lineage from that of G. menardii occurred between 5.03 Ma (Site 503A) and 4.62 Ma (Site 502A).
Diagnosis: In the ∂x versus ∂y morphospace G. multicamerata follows a trend similar to those of G. menardii menardii and G. limbata, but has 8 or more chambers in the last whorl, which makes this form very distinctive. The keel angle Φ1 of G. multicamerata is narrower than the Φ1 values of contemporaneous specimens of G. limbata. G. multicamerata is a descendant either of G. limbata (viz & ,
1983) or of G. menardii 'B' (viz ,
1970). Here, these two forms are considered synonymous (see section "Taxonomic Concept"). At DSDP Sites 502A and 503A the morphological separation of the G. limbata - G. multicamerata lineage from that of G. menardii occurred between 5.03 Ma (Site 503A) and 4.62 Ma (Site 502A).
![]() In the introduction it was predicted that the populations of menardiform globorotalids in the Caribbean would diverge morphologically from those in eastern equatorial Pacific after the Central American landbridge separated the two oceans. What do the two cores studied tell us? There is no simple response and the author is aware that more biogeographic coverage is needed to understand more accurately the observed patterns in terms of evolution. One signal from the record presented here is the overall increase in size of morphotype alpha during Late Miocene to Late Pleistocene times. This trend occurred at both the Caribbean and Pacific sites. It is not manifested so much as a increase of the mean of test size, but rather as a continuous extension upward of the large-size end of the assemblages from one interval of time to the next. At the low end of the size distributions almost nothing changed upsection. The two phenomena thus present an overall "diffusive" evolutionary pattern (,
1990). The cause for this pattern remains poorly understood. To some degree it is certainly an expression of 's Rule (,
1973), but alternative explanations for evolution in body size exist ( et alii,
2006, and references therein). If increase in cell size is interpreted as an increase in the diversity of the size spectrum of cell bodies, the pattern described may signal the response of communities during phases of environmental stability in the sense of &
(1969). In this perspective increase in cell size (and consequently an increase of test dimensions) reflects community maturation by trophic adaptation, analogous to that in larger benthic foraminifera as discussed in
(1997, 2001). This long-term trend of slow increase in test size in morphotype alpha was accompanied by at least two shorter intervals of morphological change, i.e.:
In the introduction it was predicted that the populations of menardiform globorotalids in the Caribbean would diverge morphologically from those in eastern equatorial Pacific after the Central American landbridge separated the two oceans. What do the two cores studied tell us? There is no simple response and the author is aware that more biogeographic coverage is needed to understand more accurately the observed patterns in terms of evolution. One signal from the record presented here is the overall increase in size of morphotype alpha during Late Miocene to Late Pleistocene times. This trend occurred at both the Caribbean and Pacific sites. It is not manifested so much as a increase of the mean of test size, but rather as a continuous extension upward of the large-size end of the assemblages from one interval of time to the next. At the low end of the size distributions almost nothing changed upsection. The two phenomena thus present an overall "diffusive" evolutionary pattern (,
1990). The cause for this pattern remains poorly understood. To some degree it is certainly an expression of 's Rule (,
1973), but alternative explanations for evolution in body size exist ( et alii,
2006, and references therein). If increase in cell size is interpreted as an increase in the diversity of the size spectrum of cell bodies, the pattern described may signal the response of communities during phases of environmental stability in the sense of &
(1969). In this perspective increase in cell size (and consequently an increase of test dimensions) reflects community maturation by trophic adaptation, analogous to that in larger benthic foraminifera as discussed in
(1997, 2001). This long-term trend of slow increase in test size in morphotype alpha was accompanied by at least two shorter intervals of morphological change, i.e.:
![]() 1). A Late Miocene to Late Pliocene (5.65 Ma-2.29 Ma) interval, when forms with a comparable degree of inflation and an increased number of chambers per final whorl evolved from morphotype alpha leading to morphotypes gamma and delta (G. limbata - G. multicamerata lineage). A progressive evolution to larger size occurred in these descendent forms as well, especially between
3.11 and 2.29 Ma. The putative separation of the morphotype gamma-morphotype delta lineage from the G. menardii stock in the two cores is estimated to have occurred between 4.62 and 4.14 Ma at Site 502A and between 4.35 and 3.76 Ma at Site 503A. These time intervals coincide with phase II of the major periods in the formation of the isthmus described in the introduction.
1). A Late Miocene to Late Pliocene (5.65 Ma-2.29 Ma) interval, when forms with a comparable degree of inflation and an increased number of chambers per final whorl evolved from morphotype alpha leading to morphotypes gamma and delta (G. limbata - G. multicamerata lineage). A progressive evolution to larger size occurred in these descendent forms as well, especially between
3.11 and 2.29 Ma. The putative separation of the morphotype gamma-morphotype delta lineage from the G. menardii stock in the two cores is estimated to have occurred between 4.62 and 4.14 Ma at Site 502A and between 4.35 and 3.76 Ma at Site 503A. These time intervals coincide with phase II of the major periods in the formation of the isthmus described in the introduction.
![]() 2). A Late Pleistocene-Holocene interval, when the previously unimodal ∂x versus ∂y distribution of morphotype alpha separated into morphotype alpha and morphotype beta. Splitting occurred well after the final closure of the Central American Seaway. The more persistent group, morphotype alpha occurs at both sites. The other group, morphotype beta, is a derived form with less inflated and non-incrusted shells and occurs mainly at the Caribbean site. The morphological differences between these two forms are subtle but increase with the expansion in the size of the test and are consistent during the Pleistocene to Holocene. These observations are supported by the perceptions of &
(1960) and (1969) that G. menardii menardii and G. menardii cultrata
are conspecific, not synonymous, and that an opinion validating the synonomy of G. menardii menardii and G. menardii cultrataby , &
(1978) is erroneous. The differences in the morphology of the two morphotypes is not a result of preferential dissolution of smaller tests, because the ratio of ∂x/∂y is independent of size (dissolution would favor the elimination of small tests but would not affect the slope of the ∂x vs ∂y distributions). Based on the volume to weight relationships of the tests and on the findings from stable isotopes &
(1991) saw two distinct sub-populations in Holocene G. menardii, and related this bimodality to formation of a crust during ontogeny and growth.
2). A Late Pleistocene-Holocene interval, when the previously unimodal ∂x versus ∂y distribution of morphotype alpha separated into morphotype alpha and morphotype beta. Splitting occurred well after the final closure of the Central American Seaway. The more persistent group, morphotype alpha occurs at both sites. The other group, morphotype beta, is a derived form with less inflated and non-incrusted shells and occurs mainly at the Caribbean site. The morphological differences between these two forms are subtle but increase with the expansion in the size of the test and are consistent during the Pleistocene to Holocene. These observations are supported by the perceptions of &
(1960) and (1969) that G. menardii menardii and G. menardii cultrata
are conspecific, not synonymous, and that an opinion validating the synonomy of G. menardii menardii and G. menardii cultrataby , &
(1978) is erroneous. The differences in the morphology of the two morphotypes is not a result of preferential dissolution of smaller tests, because the ratio of ∂x/∂y is independent of size (dissolution would favor the elimination of small tests but would not affect the slope of the ∂x vs ∂y distributions). Based on the volume to weight relationships of the tests and on the findings from stable isotopes &
(1991) saw two distinct sub-populations in Holocene G. menardii, and related this bimodality to formation of a crust during ontogeny and growth.
![]() Constriction and closure of the seaway affected the environment of the Atlantic more than that of the Eastern Equatorial Pacific ( & ,
2007). To some degree this difference is reflected in a change in size of morphotypes alpha and beta. In specimens from the Caribbean Sea Site the increase in size is especially dramatic during and after Phase III of Isthmus formation, i.e. after 2.58 Ma (see
Fig. 10
Constriction and closure of the seaway affected the environment of the Atlantic more than that of the Eastern Equatorial Pacific ( & ,
2007). To some degree this difference is reflected in a change in size of morphotypes alpha and beta. In specimens from the Caribbean Sea Site the increase in size is especially dramatic during and after Phase III of Isthmus formation, i.e. after 2.58 Ma (see
Fig. 10 ![]() ). At the Pacific Site the increase in size occurred earlier, after 2.93 Ma (see
Fig. 11
). At the Pacific Site the increase in size occurred earlier, after 2.93 Ma (see
Fig. 11 ![]() ) but was less pronounced. During this time warming prevailed and led to stratification and increased salinity in the Caribbean Sea ( et alii,
1989).
Figure 3
) but was less pronounced. During this time warming prevailed and led to stratification and increased salinity in the Caribbean Sea ( et alii,
1989).
Figure 3 ![]() illustrates these known environmental changes at DSDP Site 502A in a graph of the abundance of Globigerinoides ruber and a rising faunal divergence in surface dwellers (data from et alii,
1989). A comparison of
Figure 3
illustrates these known environmental changes at DSDP Site 502A in a graph of the abundance of Globigerinoides ruber and a rising faunal divergence in surface dwellers (data from et alii,
1989). A comparison of
Figure 3 ![]() with its increase in the diversity of surface fauna and in the abundance of Globigerinoides ruber indicating an increase in the salinity of surface waters over time at Site 502A) with
Figures 7
with its increase in the diversity of surface fauna and in the abundance of Globigerinoides ruber indicating an increase in the salinity of surface waters over time at Site 502A) with
Figures 7 ![]() (enlargement of ∂x and ∂y
upsection), 10
(enlargement of ∂x and ∂y
upsection), 10 ![]() (upsection increase in test area in keel view), and
12
(upsection increase in test area in keel view), and
12 ![]() (changes in Φ1) suggests that to a considerable extent the morphological changes in the menardiform group were related to the paleoenvironment. Two alternative ecological models come to mind to explain Late Pleistocene developments in G. menardii:
(changes in Φ1) suggests that to a considerable extent the morphological changes in the menardiform group were related to the paleoenvironment. Two alternative ecological models come to mind to explain Late Pleistocene developments in G. menardii:
![]() Model (I): G. menardii consists of a single species but develops two populations, that show different degrees of calcification and crust formation. These differences are due to the siting of the living tests at different depths and are interpreted in light of the processes of growth. This is the explanation given in &
(1991). Under these circumstances the morphotypes alpha and beta described in the present study represent ecophenotypes that developed because of their settling in progressively deeper waters during ontogeny and maturation. A formal affirmation that morphotype alpha is G. menardii menardii and morphotype beta is G. menardii cultrata would be inappropriate if this proves to be true.
Model (I): G. menardii consists of a single species but develops two populations, that show different degrees of calcification and crust formation. These differences are due to the siting of the living tests at different depths and are interpreted in light of the processes of growth. This is the explanation given in &
(1991). Under these circumstances the morphotypes alpha and beta described in the present study represent ecophenotypes that developed because of their settling in progressively deeper waters during ontogeny and maturation. A formal affirmation that morphotype alpha is G. menardii menardii and morphotype beta is G. menardii cultrata would be inappropriate if this proves to be true.
![]() Model (II): Morphotype alpha and morphotype beta represent two populations, that live and reproduce at different levels in the water column, and so became reproductively separated by the emplacement of vertical hydrological, chemical, nutritional or light gradients (depth parapatry
sensu , 1983). Similar conclusions concerning vicariant depth habitats were based on stable isotope analyses of some extinct Pliocene menardiform globorotalids (,
2003). For morphotype alpha and morphotype beta the observed morphological divergence would reflect the development and separation of discrete vertical niches in the water column, to which the two populations became adapted and eventually during the past 0.22 million years began to diverge as disparate entities. The hydrological changes responsible may have been the buildup of a lense of strongly stratified waters in the Caribbean Sea after permanent closure occurred. If this model holds true, the two morphotypes alpha and beta would eventually represent the early stages of a speciation. The taxonomic consequences would be that morphotype alpha be designated as G. menardii menardii and morphotype beta be referred to G. menardii cultrata, each a discrete species.
Model (II): Morphotype alpha and morphotype beta represent two populations, that live and reproduce at different levels in the water column, and so became reproductively separated by the emplacement of vertical hydrological, chemical, nutritional or light gradients (depth parapatry
sensu , 1983). Similar conclusions concerning vicariant depth habitats were based on stable isotope analyses of some extinct Pliocene menardiform globorotalids (,
2003). For morphotype alpha and morphotype beta the observed morphological divergence would reflect the development and separation of discrete vertical niches in the water column, to which the two populations became adapted and eventually during the past 0.22 million years began to diverge as disparate entities. The hydrological changes responsible may have been the buildup of a lense of strongly stratified waters in the Caribbean Sea after permanent closure occurred. If this model holds true, the two morphotypes alpha and beta would eventually represent the early stages of a speciation. The taxonomic consequences would be that morphotype alpha be designated as G. menardii menardii and morphotype beta be referred to G. menardii cultrata, each a discrete species.
![]() However, the morphological data available from this study cannot alone determine a final choice between model (I) and (II). First, a larger biogeographic coverage of similar morphometric measurements in cores is needed to map the presumed endemism of morphotype beta to the Caribbean Sea and the adjacent Atlantic realm. In addition, the biogeography of the suggested divergence of morphotypes alpha and beta during the past 0.22 Ma must be mapped over a much larger area and at a higher level of stratigraphical resolution. Second, measurements of stable isotopes combined with Ca/Mg thermometry on living plankton and time-series sediment traps would allow a differentiation of the depth habitats and vertical dynamics of the two morphotypes. Third, a molecular taxonomy is needed to provide further evidence for a definitive differentiation of morphotypes alpha and beta on either a specific or a subspecific level.
However, the morphological data available from this study cannot alone determine a final choice between model (I) and (II). First, a larger biogeographic coverage of similar morphometric measurements in cores is needed to map the presumed endemism of morphotype beta to the Caribbean Sea and the adjacent Atlantic realm. In addition, the biogeography of the suggested divergence of morphotypes alpha and beta during the past 0.22 Ma must be mapped over a much larger area and at a higher level of stratigraphical resolution. Second, measurements of stable isotopes combined with Ca/Mg thermometry on living plankton and time-series sediment traps would allow a differentiation of the depth habitats and vertical dynamics of the two morphotypes. Third, a molecular taxonomy is needed to provide further evidence for a definitive differentiation of morphotypes alpha and beta on either a specific or a subspecific level.
![]() 1). Four menardiform globorotalid morphotypes alpha, beta, gamma
and delta are proposed, that can be distinguished morphometrically using spiral height (∂x), axial diameter (∂y), keel angle (Φ1), and the number of chambers in the final whorl.
1). Four menardiform globorotalid morphotypes alpha, beta, gamma
and delta are proposed, that can be distinguished morphometrically using spiral height (∂x), axial diameter (∂y), keel angle (Φ1), and the number of chambers in the final whorl.
![]() 2). In the ∂x versus ∂y space, a line with the equation ∂y = 3.2 * ∂x -160 separates morphotype alpha (located below the line) from morphotype beta (above the line).
2). In the ∂x versus ∂y space, a line with the equation ∂y = 3.2 * ∂x -160 separates morphotype alpha (located below the line) from morphotype beta (above the line).
![]() 3). The extant morphotype alpha is ancestral to morphotypes beta, gamma and delta. Morphotype alpha corresponds morphologically with forms described in the literature as G. menardii menardii and includes the junior synonym of G. menardii 'A'
(1970). The extant morphotype beta is the equivalent of forms described as G. menardii cultrata (without peripheral spines) and G. fimbriata (with peripheral spines). The existence of the two morphotypes is explained by two ecological models, i.e. ontogenetic variation of test calcification (Model I) or depth parapatry (Model II). Whether these morphotypes are but ecophenotypes or are discrete species cannot be determined definitively at this moment, for further investigation is mandatory.
3). The extant morphotype alpha is ancestral to morphotypes beta, gamma and delta. Morphotype alpha corresponds morphologically with forms described in the literature as G. menardii menardii and includes the junior synonym of G. menardii 'A'
(1970). The extant morphotype beta is the equivalent of forms described as G. menardii cultrata (without peripheral spines) and G. fimbriata (with peripheral spines). The existence of the two morphotypes is explained by two ecological models, i.e. ontogenetic variation of test calcification (Model I) or depth parapatry (Model II). Whether these morphotypes are but ecophenotypes or are discrete species cannot be determined definitively at this moment, for further investigation is mandatory.
![]() 4). At DSDP Sites 502A and 503A two extinct morphotypes gamma and delta evolved from G. menardii menardii between 4.62 Ma and 3.76 Ma. They are the equivalents of the extinct morphospecies G. limbata
(1902) and G. multicamerata &
(1930), respectively. They can be distinguished from G. menardii menardii by a greater number of chambers in the final whorl (6 to 7, the "7's" predominate in G. limbata; ≥ 8 in G. multicamerata) and by a smaller keel angle (Φ1). G. menardii 'B' (,
1970) is a later synonym of the transitional forms between G. menardii menardiiand G. limbata.
4). At DSDP Sites 502A and 503A two extinct morphotypes gamma and delta evolved from G. menardii menardii between 4.62 Ma and 3.76 Ma. They are the equivalents of the extinct morphospecies G. limbata
(1902) and G. multicamerata &
(1930), respectively. They can be distinguished from G. menardii menardii by a greater number of chambers in the final whorl (6 to 7, the "7's" predominate in G. limbata; ≥ 8 in G. multicamerata) and by a smaller keel angle (Φ1). G. menardii 'B' (,
1970) is a later synonym of the transitional forms between G. menardii menardiiand G. limbata.
![]() 5). G. menardii menardii increased in size considerably in the past 8 million years along with a superimposed progressive flattening of the test. There is an asymmetry in the morphological development of the forms seen in the Caribbean and Pacific cores: The menardiform globorotalids from the Caribbean Sea show an accelerated increase in size after 2.58 Ma (i.e. during and after final closure of the Central American Seaway). A flattening of the tests occurred repeatedly, first during the Pliocene (development of the morphotypes alpha-gamma-delta [G. menardii menardii-G. limbata-G. multicamerata] lineage) and, again during the Late Pleistocene, after the ancient sea-connection had been
closed (divergence of morphotypes alpha and beta). The development of morphotype beta is more pronounced on the Caribbean side than on the Pacific side, reflecting an asymmetry in watermass development in the two oceans in the course of the formation of the isthmus. On the Pacific side for 8 Ma all menardiform globorotalids show a more gradual increase in size than those in the Caribbean. The differences in test size pre- and post- isthmian closure are smaller in the Eastern Equatorial Pacific than on the Atlantic side. During the Late Pleistocene divergence into morphotypes alpha and beta was quite marked in the Caribbean samples, but on the Pacific site the two morphotypes appear to be more mixed.
5). G. menardii menardii increased in size considerably in the past 8 million years along with a superimposed progressive flattening of the test. There is an asymmetry in the morphological development of the forms seen in the Caribbean and Pacific cores: The menardiform globorotalids from the Caribbean Sea show an accelerated increase in size after 2.58 Ma (i.e. during and after final closure of the Central American Seaway). A flattening of the tests occurred repeatedly, first during the Pliocene (development of the morphotypes alpha-gamma-delta [G. menardii menardii-G. limbata-G. multicamerata] lineage) and, again during the Late Pleistocene, after the ancient sea-connection had been
closed (divergence of morphotypes alpha and beta). The development of morphotype beta is more pronounced on the Caribbean side than on the Pacific side, reflecting an asymmetry in watermass development in the two oceans in the course of the formation of the isthmus. On the Pacific side for 8 Ma all menardiform globorotalids show a more gradual increase in size than those in the Caribbean. The differences in test size pre- and post- isthmian closure are smaller in the Eastern Equatorial Pacific than on the Atlantic side. During the Late Pleistocene divergence into morphotypes alpha and beta was quite marked in the Caribbean samples, but on the Pacific site the two morphotypes appear to be more mixed.
![]() In general, the superimposed morphological development (shell inflation) analyzed for the morphotypes gamma � delta lineage during the Pliocene and for the Late Pleistocene morphotypes alpha and beta is interpreted as an ecological response to an increase in the stratification of the water column in the Caribbean Sea (shown by
et alii, 1989), that came into existence during the formation of the Isthmus of Panama and remained in place. Returning to the prediction made in the 'Introduction' to this study I conclude from these preliminary data that the emergence of the Isthmus of Panama had a sensible influence on the morphological evolution of menardiform
globorotalids.
In general, the superimposed morphological development (shell inflation) analyzed for the morphotypes gamma � delta lineage during the Pliocene and for the Late Pleistocene morphotypes alpha and beta is interpreted as an ecological response to an increase in the stratification of the water column in the Caribbean Sea (shown by
et alii, 1989), that came into existence during the formation of the Isthmus of Panama and remained in place. Returning to the prediction made in the 'Introduction' to this study I conclude from these preliminary data that the emergence of the Isthmus of Panama had a sensible influence on the morphological evolution of menardiform
globorotalids.
![]() Several persons have helped in making this study possible, to whom I wish to express my thanks: J�rg prepared samples and assisted in extracting age information from the Initial Reports of the DSDP, Marianne and Hanspeter helped in imaging foraminifera, and the curators and technicians of the Ocean Drilling Program generously provided DSDP samples. I thank Norman and John for their critical readings of an earlier version, Frans and an anonymous reviewer for their comments, and Kevin and Nestor for polishing the English. This study was made possible through the combined support from the (SNF Grants No. 2000-043058.95/1, No. 2000-050558.97/1, 2000-056875.99/1), contributions from the in Basel and the in Basel, and the City of Basel.
Several persons have helped in making this study possible, to whom I wish to express my thanks: J�rg prepared samples and assisted in extracting age information from the Initial Reports of the DSDP, Marianne and Hanspeter helped in imaging foraminifera, and the curators and technicians of the Ocean Drilling Program generously provided DSDP samples. I thank Norman and John for their critical readings of an earlier version, Frans and an anonymous reviewer for their comments, and Kevin and Nestor for polishing the English. This study was made possible through the combined support from the (SNF Grants No. 2000-043058.95/1, No. 2000-050558.97/1, 2000-056875.99/1), contributions from the in Basel and the in Basel, and the City of Basel.
R. & M. (eds.), W.L., J.V., C.G., G., A.J., L.D., D.V., M.T., U., A.J. Jr, W.R., C., D.J. & H.B. (1982).- Initial Reports of the Deep Sea Drilling Project, College Station, vol. LXVIII, 495 p.
A.J., D.C. & W.C. (1995).- Causality and 's Rule: Evidence from the planktonic foraminifera.- Journal of Paleontology, Lawrence, vol. 69, n° 2, p. 203-210.
G. & T. (1998).- Measurement error in geometric morphometrics: Empirical strategies to assess and reduce its impact on measures of shape.- Acta Zoologica Academiae Scientiarum Hungaricae, Budapest, vol. 44, n° 1-2, p. 73-96.
O.L. (1972).- Origin and development of Globorotalia (Turborotalia) pachyderma ().- Micropaleontology, New York, vol. 18, n° 3, p. 294-318.
F.T. & W.H. (1960).- Some primary types of species belonging to the superfamily Globigerinaceae.- Contributions from the Cushman Foundation for Foraminiferal Research, New York, vol. 11, part 1, p. 1-41.
F.T. & W.H. (1965).- Progress in the planktonic foraminiferal biostratigraphy of the Neogene.- Nature, London, vol. 208, p. 1164-1166.
A.W.H., A. & D.L. (1966).- Shell microstructure of a planktonic foraminifer, Globorotalia menardii (d').- Eclogae Geologicae Helvetiae, Basel, vol. 59, n° 2, p. 885-896.
J.P., D.R. & N.J. (1989).- K/Ar age dating of the ophiolitic Nicoya Complex of the Osa Peninsula, southern Costa Rica.- Journal of South American Earth Sciences, Oxford, vol. 2, n° 1, p. 49-59.
W.A., D.V., C.C. & M.-P. (1995).- A revised Cenozoic geochronology and chronostratigraphy.- In: W.A., D.V., M.-P. & J. (eds.), Geochronology, time scales and global stratigraphic correlation.- Society of Economic Paleontologists and Mineralogists, Special Publication, Tulsa, n° 54, p. 129-212.
W.H. (1979).- The Cainozoic Globigerinida.- Text, part I and II, Section I, Leiden, 752 p.
H.M. (1970).- The foraminifera of Sites 23-31, Leg 4.- Initial Reports of the Deep Sea Drilling Project, College Station, vol. 4, p. 577-643.
H.M. (1986).- Evolutionary trends in planktonic foraminifera from Early Cretaceous to Recent, with special emphasis on selected Tertiary lineages.- Bulletin des Centres de Recherches Exploration et Production elf-Aquitaine, Pau, vol. 10, n° 2, p. 565-577.
H.M. & J.B. (1985).- Oligocene to Holocene low latitude planktic foraminifera.- In: H.M., J.B. & K. (eds.), Plankton stratigraphy.- Cambridge University Press, Cambridge, p. 155-262.
H.B. (1884).- Report on the foraminifera dredged by H.M.S. Challenger, during the years 1873-1876.- Reports of the Scientific Results of H.M.S. Challenger 1873-6, London, vol. 9 (zoology), p. 1-84.
P.W. & D.M. (1969).- Adaptive response to environmental stability: A unifying concept in paleoecology.- Proceedings of the North American Paleontological Convention, I, Allen Press, Lawrence, p. 522-550.
S.C. & D.V. (1995).- Revised calibration of the geomagnetic polarity timescale for the Late Cretaceous and Cenozoic.- Journal of Geophysical Research, Washington D.C., vol. 100(B4), p. 6093-6095.
W.P. (2003).- Vicarious living: Pliocene menardellids between an isthmus and an ice sheet.- Geology, Boulder, vol. 31, n° 12, p. 1085-1088.
R. (1969).- Radiation of Cenozoic planktonic foraminifera.- Systematic Zoology, Washington D.C., vol. 18, p. 154-168.
R. & G. (1979).- New Late Miocene and Pliocene occurrences of Globorotalia species from the North Atlantic; and a paleogeographic review.- Journal of Foraminiferal Research, Lawrence, vol. 9, n° 3, p. 210-227.
R. & C. (1976).- Planktonic foraminifera from near the west African coast and a consideration of faunal parcelling in the North Atlantic.- Journal of Foraminiferal Research, Lawrence, vol. 6, n° 4, p. 258-273.
A.G., M.-P., W.A., L.S. & M. (2003).- Early Neogene history of the Central American arc from Bocas del Toro, western Panama.- Geological Society of America, Bulletin, Boulder, vol. 115, n° 3, p. 271-287.
A.C., J.B.C., L.S., T.M., H.J., L.M., P. & J.A. (1992).- Closure of the Isthmus of Panama: The near-shore marine record of Costa Rica and Panama.- Geological Society of America Bulletin, Boulder, vol. 104, p. 814-828.
A.G. & J.A. (1996).- The geologic evolution of the Central American Isthmus.- In: J.B., A.F. & A.G. (eds.), Evolution and environment in tropical America.- The University of Chicago Press, Chicago, p. 21-56.
L.S., A.G., W.A., M.-P. & J. (1996).- The late Miocene Panama isthmian strait.- Geology, Boulder, vol. 24, n° 8, p. 687-690.
L.C., A.G. & J.A. (1995).- Timing and rates of of emergence of the Limon and Bocas del Toro Basins: Caribbean effects of Coccos subduction? - In: P. (ed.), Geologic and tectonic development of the Caribbean Plate boundary in southern America.- Geological Society of America Bulletin, Special Paper, Boulder, 295, p. 263-289.
J.A. & P.W. (1930).- Miocene foraminifera from Buff Bay, Jamaica.- Journal of Paleontology, Lawrence, vol. 4, n° 4, p. 353-368.
K.F., D., C.M. & A.J. (1996).- Molecular phylogeny of the planktic foraminifera.- Journal of Foraminiferal Research, Lawrence, vol. 26, n° 4, p. 324-330.
K.F., C.M., D. & A.J. (1997).- Planktic foraminiferal molecular evolution and their polyphyletic origins from benthic taxa.- Marine Micropaleontology, Amsterdam, vol. 30, p. 251-266.
K.F., C.M., D., A.J. & J. (1999).- The diversity and distribution of modern planktic foraminiferal small subunit ribosomal RNA genotypes and their potential as tracers of present and past ocean circulations.- Paleoceanography, Washington D.C., vol. 14, n° 1, p. 3-12.
K.F., C.M., I.A., D., R. & A.J. (2000).- Molecular evidence for genetic mixing of arctic and antarctic subpolar populations of planktonic foraminifers.- Nature, London, vol. 405, p. 43-47.
K.F., M., C.J. & C. (2004).- Molecular evidence links cryptic diversification in polar plankton protists to Quaternary climate dynamics.- Proceedings of the National Academy of Sciences of the USA, Washington D.C., vol. 101, n° 20, p. 7657-7662.
C., L., H. & J. (1997).- Phylogeny and rates of molecular evolution of planktonic foraminifera: SSU rDNA sequences compared to the fossil record.- Journal of Molecular Evolution, New York, vol. 45, p. 285-294.
T. (1935).- A critique of the species concept in biology.- Philosophy and Science, Baltimore, vol. 2, p. 344-355.
H. (1990).- Neogene stratigraphy, paleoceanography and paleobiogeography in northwest South America and the evolution of the Panama Seaway.- Palaeogeography, Palaeoclimatology, Palaeoecology, Amsterdam, vol. 77, p. 203-234.
C. (1902).- Sinossi metodica dei foraminiferi sin qui rinvenuti nella sabbia del Lido di Rimini.- Reale Accademia delle Scienze dell'Istituto di Bologna, Memorie di Scienze Naturali, (ser. 5), vol. 10 (1902-1904), p. 1-68.
G.H. & R. (1998).- Effect of the formation of the Isthmus of Panama on Atlantic Ocean thermohaline circulation.- Nature, London, vol. 393, p. 673-676.
L. (1997).- Shallow benthic foraminiferal assemblages as signals for depth of their deposition and their limitations.- Bulletin de la Société géologique de France, Paris, t. 168, n° 4, p. 491-505.
L. (2001).- Learning from the past? - In: R., D., R. & F. (eds.), Frontiers of life, vol. 4(2): Discovery and spoliation of the biosphere.- Academic Press, San Diego, p. 449-477.
B.T., J. & K. (1997).- Cryptic speciation in the living planktic foraminifer Globigerinella siphonifera (d').- Paleobiology, Lawrence, vol. 23, p. 33-62.
M. (2002).- Responses of planktonic foraminifera to the emergence of the Isthmus of Panama.- Revista Mexicana de Ciencias Geologicas, vol. 19, n° 3, p. 152-160.
J.B.C., A.F. & A.G. (1996).- Evolution and environment in tropical America.- The University of Chicago Press, Chicago, 425 p.
S. & L.S. (2007).- Trends in Caribbean paleoproductivity related to the Neogene closure of the Central American Seaway.- Marine Micropaleontology, Amsterdam, vol. 63, p. 57-74.
K.H. (2000).- The Venezuelan hydrocarbon habitat. Part 1: Tectonics, structure, palaeogeography and source rocks.- Journal of Petroleum Geology, Beaconsfield, vol. 23, n° 1, p. 5-53.
K. & T. (2000).- Biogeography of Neogene calcareous nannofossils in the Caribbean and the eastern equatorial Pacific-floral response to the emergence of the Isthmus of Panama.- Marine Micropaleontology, Amsterdam, vol. 39, p. 201-218.
G., C.E. & S.M. (1989).- Late Neogene history of the Pacific-Caribbean gateway.- Journal of South American Earth Sciences, Amsterdam, vol. 2, p. 73-108.
J.P. & M.S. (1983).- Neogene planktonic foraminifera. A phylogenetic atlas.- Hutchinson Ross Publishing Company, Stroudsburg, Pennsylvania, 265 p.
D.V. & D.J. (1982).- Magnetostratigraphy of Caribbean Site 502A hydraulic piston cores.- Initial Reports of the Deep Sea Drilling Project, College Station, vol. 68, p. 419-433.
L.D. (1976).- Late Cenozoic planktonic foraminiferal biostratigraphy and paleoceanography of the Panama Basin.- Micropaleontology, New York, vol. 22, n° 4, p. 419-442.
L.D. Jr (1978).- Pliocene closing of the Isthmus of Panama, based on biostratigraphic evidence from nearby Pacific Ocean and Caribbean Sea cores.- Geology, Boulder, vol. 6, p. 630-634.
L.D. Jr (1982).- Neogene planktonic foraminifers from Deep-Sea Drilling Project Sites 502 and 503.- Initial Reports of the Deep Sea Drilling Project, College Station, vol. 68, p. 269-288.
M. (1998).- A simple Fortran 77 program for the outline detection of digitized microfossils.- Computers & Geosciences, Oxford, vol. 24, n° 9, p. 897-900.
M. (2004).- MorphCol - A collection of Fortran 77 programs for geometric morphometry.- Technical Report. Naturhistorisches Museum Basel, Augustinergasse 2, 4001-Basel, Switzerland, 120 p., URL: http://www.unibas.ch/museum/microfossils/Research/MORPHCOL/Start.html
M. (2007).- Analysis of variation in shape and size due to repeated manual positioning of a single microfossil into the same position.- MorphCol Supplement 3. Unpublished Technical Report, Naturhistorisches Museum Basel, 9 p.
M. & K.F. (2002).- Cryptic species of planktonic foraminifera: Their effect on palaeoceanographic reconstructions.- Philosophical Transactions of the Royal Society of London, vol. 260(A), p. 695-718.
J.L. & J.H. (1972).- Late Neogene planktonic foraminifers in the Caribbean, Gulf of Mexico, and Italian stratotypes.- The University of Kansas Paleontological Contributions, Lawrence, Article 57 (Protozoa 8), 67 p.
D. (1983).- Speciation in marine protists and its study in the planktonic microfossil record: A review.- Paleobiology, Lawrence, vol. 9, p. 327-340.
D. (1992).- Age depth plot and age maker: Age modeling of stratigraphic sections on the Macintosh series of computers.- Geobyte, vol. 2, p. 7-13.
M.A., G.H., M., R., H. & R. (1995).- Northwest Pacific Site 882: The initiation of Northern Hemisphere glaciation.- Proceedings of the Ocean Drilling Program, Scientific Results, College Station, vol. 145, p. 315-329.
E. (1967).- Artbegriff und Evolution.- Paul Parey, Hamburg, 617 p.
K. (1996).- Benthic foraminiferal response to the emergence of the Isthmus of Panama and coincident paleoceanographic changes.- Marine Micropaleontology, Amsterdam, vol. 28, p. 133-169.
M.L. (1990).- Trends in body-size evolution.- In: K.J. (ed.), Evolutionary trends.- The University of Arizona Press, Tuscon, p. 75-118.
R.V. & J.D.D. (1987).- Official lists and indexes of names and works in zoology.- International Trust for Zoological Nomenclature, on behalf of the International Commission on Zoological Nomenclature, London, 366 p., URL: http://www.iczn.org/names_works_zoology.pdf
A.C., N.G., W., J., A. & T.K. (1995).- Benthic foraminifer stable isotope record from Site 849 (0-5 Ma): Local and global climate changes.- Proceedings of the Ocean Drilling Program, Scientific Results, College Station, vol. 138, p. 371-411.
R.D., R.M. & J. (1996).- What is gradualism? Cryptic speciation in globorotaliid foraminifera.- Paleobiology, Lawrence, vol. 22, n° 3, p. 386-405.
A. d' (1826).- Tableau méthodique de la classe des céphalopodes.- Annales des Sciences Naturelles de Paris, Paris, vol. 1, n° 7, p. 96-314.
A. d' (1839).- Foraminifères.- In: R. de la (ed.), Histoire physique, politique et naturelle de l'�le de Cuba.- Arthus Bertrand, Paris, 224 p.
W.C., A. & A.J. (1999).- Paleobiogeographic patterns in the morphologic diversification of the Neogene planktonic foraminifera.- Palaeogeography, Palaeoclimatology, Palaeoecology, Amsterdam, vol. 152, p. 1-14.
W.K., T.R. & H.B. (1865).- On the nomenclature of the foraminifera; Part XII. The species enumerated by d' in the Annales des Sciences Naturelles, vol. 7, 1826.- Annual Magazine of Natural History London, ser. 3, vol. 16, p. 15-41.
P.N. (1998).- Stable isotopes and the study of evolution in planktonic foraminifera.- Paleontological Society Papers, Pittsburgh, vol. 4, p. 138-178.
N.G., L.A. & A.C. (1995).- Paleoceanography of the eastern equatorial Pacific during the Neogene: Synthesis of Leg 138 drilling results.- Proceedings of the Ocean Drilling Program, Scientific Results, College Station, vol. 138, p. 5-21.
W.L. (1982).- Oxygen and carbon isotope stratigraphy for the Quaternary of Hole 502B: Evidence for two modes of isotopic variability.- Initial Reports of the Deep Sea Drilling Project, College Station, vol. 68, p. 455-464.
W. & M.J. (1982).- Neogene radiolarians from the Eastern Tropical Pacific and Caribbean, Deep Sea Drilling Project Leg 68.- Initial Reports of the Deep Sea Drilling Project, College Station, vol. 68, p. 289-300.
D. (1982).- The fossil distribution of coccolithophore genus Gephyrocapsa and related Plio-Pleistocene chronostratigraphic problems.- Initial Reports of the Deep Sea Drilling Project, College Station, vol. 68, p. 325-343.
K. & G. (1985).- Evolution of the Pacific circulation in the Miocene: Radiolarian evidence from DSDP site 289.- In: J.P. (ed.), The Miocene ocean: Paleogeography and biogeography.- Geological Society of America, Memoir, Boulder, vol. 163, p. 273-290.
J.M., A.W. & K. (2000).- The Caribbean carbonate crash at the middle to late Miocene transition: Linkage to the establishment of the modern global ocean conveyor.- Proceedings of the Ocean Drilling Program, Scientific Results, College Station, vol. 165, p. 249-273.
W.F. & B.C. (1967).- Differential solution of planktonic foraminifera.- Deep-Sea Research, Oxford, vol. 14, p. 801-808.
T. (1976).- Geologic significance of coiling direction in the planktonic foraminifera Pulleniatina.- Geology, Boulder, vol. 4, p. 305-309.
C. (1982).- Diatom biostratigraphy and paleoceanography, Deep Sea Drilling Project Leg 68.- Initial Reports of the Deep Sea Drilling Project, College Station, vol. 68, p. 301-309.
D.N., D., J.R., & M. (2006).- Biogeography and evolution of body size in marine plankton.- Earth-Science Reviews, Amsterdam, vol. 78, p. 239-266.
P.N. & G.P. (1991).- Ontogeny and habitat of modern menardiiform planktonic foraminifera.- Journal of Foraminiferal Research, Lawrence, vol. 21, n° 4, p. 332-346.
R.M., J.L., H., J.H. & R.M. (1975).- Cenozoic planktonic foraminiferal zonation and characteristics of index forms.- The University of Kansas Paleontological Contributions, Lawrence, vol. 62 p. 1-425.
R.M., J.L. & R.M. (1978).- Rotalia menardii , & , 1865 (Foraminiferida): Proposed suppression of lectotype and designation of neotype Z.N.(S.) 2145.- Bulletin of Zoological Nomenclature, London, vol. 34, n° 4, p. 252-262.
S. (1973).- An explanation for 's Rule.- Evolution, Oxford, vol. 27, n° 1, p. 1-26.
I.A., K.A., D., C.M. & S.R. (2001).- Genotypic variability in subarctic Atlantic planktic foraminifera.- Marine Micropaleontology, Amsterdam, vol. 43, p. 143-153.
K., R., Y. & F. (2007).- The oxygen isotope composition of planktonic foraminifera from the Cariaco Basin, Venezuela: Seasonal and interannual variations.- Marine Micropaleontology, Amsterdam, vol. 62, p. 180-193.
W.P. (1966).- The Panama Landbridge as a sea barrier.- Proceedings of the American Philosophical Society, Philadelphia, vol. 110, n° 6, p. 425-433.
| DSDP Site 502: | |
| Age (Ma) | Depth (mbsf) |
0.000 |
0.000 |
0.236 |
3.527 |
0.982 |
19.089 |
1.757 |
38.275 |
2.580 |
60.233 |
3.208 |
80.698 |
3.581 |
89.438 |
4.188 |
105.233 |
4.289 |
109.070 |
7.292 |
200.000 |
| DSDP Site 502A: | |
| Age (Ma) | Depth (mbsf) |
0.000 |
0.000 |
0.204 |
4.977 |
1.464 |
28.714 |
1.968 |
47.473 |
3.576 |
91.118 |
4.381 |
114.113 |
5.724 |
145.699 |
7.210 |
198.387 |
| DSDP Site 503A: | |
| Age (Ma) | Depth (mbsf) |
0.000 |
0.000 |
0.294 |
1.650 |
0.538 |
6.048 |
0.745 |
13.575 |
1.395 |
13.575 |
1.649 |
26.747 |
1.960 |
34.812 |
2.591 |
48.253 |
3.148 |
58.737 |
4.695 |
104.839 |
5.135 |
114.247 |
5.586 |
125.538 |
5.767 |
142.473 |
6.797 |
177.285 |
6.839 |
191.398 |
7.462 |
213.978 |
Table 1:
Control points of age-depth curves shown in Figure 4 ![]() .
.
| Caribbean Sites 502, 502A and 502B | |||
| Sample | Depth (mbsf) | Age (Ma) | Remarks |
| 502A-1H-1, 15-20 cm | 0.18 | 0.00 | |
| 502B-1H-1, 2.5-4 cm | 0.03 | 0.001 | |
| 502-1H-CC, 0-4 cm | 1.7 | 0.03 | |
| 502B-2H-1, 41-42 cm | 3.32 | 0.14 | |
| 502B-2H-2, 21-22 cm | 4.62 | 0.22 | |
| 502A-2H-3, 60-63 cm | 5.52 | 0.23 | |
| 502B-3H-1, 41-42 cm | 7.71 | 0.40 | |
| 502B-3H-1, 142-143 cm | 8.72 | 0.46 | |
| 502A-3H-2, 83-87 cm | 10.66 | 0.51 | |
| 502A-4H-2, 22-27 cm | 12.42 | 0.60 | barren in G. menardii |
| 502A-5H-1, 100-101 cm | 16.1 | 0.795 | barren in G. menardii |
| 502A-5H-3, 116-119 cm | 19.28 | 0.963 | barren in G. menardii |
| 502A-6H-2, 130-131 cm | 22.3 | 1.12 | |
| 502A-6H-3, 112-116 cm | 23.64 | 1.195 | barren in G. menardii |
| 502A-7H-2, 75-76 cm | 26.15 | 1.328 | barren in G. menardii |
| 502A-8H-1, 40-45 cm | 28.7 | 1.47 | |
| 502A-10H-1, 46-47 cm | 37.57 | 1.70 | |
| 502A-10H-3, 104-108 cm | 41.16 | 1.80 | barren in G. menardii |
| 502A-12H-1, 15-16 cm | 46.06 | 1.93 | barren in G. menardii |
| 502A-12H-3, 85-88 cm | 49.75 | 2.05 | barren in G. menardii |
| 502-13H-3, 96-100 cm | 52.76 | 2.30 | barren in G. menardii |
| 502A-16H-1, 52-57 cm | 64.02 | 2.58 | * |
| 502A-17H-3, 120-123 cm | 72.12 | 2.88 | * |
| 502A-19H-2, 27-31 cm | 78.49 | 3.11 | * |
| 502A-21H-1, 55-58 cm | 86.05 | 3.39 | * |
| 502A-22H-3, 139-144 cm | 94.32 | 3.69 | * |
| 502A-24H-3, 125-127 cm | 102.96 | 3.99 | |
| 502A-25H-3, 111-114 cm | 107.22 | 4.14 | * |
| 502A-27H-1, 130-134 cm | 113.22 | 4.35 | |
| 502A-29H-1, 51-56 cm | 119.81 | 4.62 | |
| 502A-30H-1, 50-52 cm | 123.31 | 4.77 | barren in G. menardii |
| 502A-32H-1, 35-39 cm | 128.67 | 5.00 | * |
| 502A-33-3, 2-6 cm | 134.34 | 5.24 | * |
| 502A-38-2, 38-40 cm | 147.69 | 5.78 | |
| 502A-42-2, 110-115 cm | 158.43 | 6.08 | |
| 502A-48-2, 21-25 cm | 173.03 | 6.49 | |
| 502A-55H-2, 43-47 cm | 189.25 | 6.95 | |
| 502A-58H-1, 115-120 cm | 194.45 | 7.10 | |
| Equatorial Pacific Sites 503 and 503A | |||
| Sample | Depth (mbsf) | Age (Ma) | Remarks |
| 503-1H-1, 0-3 cm | 0.01 | 0.20 | |
| 503A-1H-1, 73-87 cm | 0.8 | 0.22 | |
| 503A-2H-1, 95-96 cm | 2.75 | 0.35 | |
| 503A-2H-2, 25-28 cm | 3.56 | 0.40 | |
| 503A-4H-2, 85-89 cm | 12.97 | 0.73 | |
| 503A-5H-2, 10-14 cm | 16.63 | 1.45 | |
| 503A-9H-1, 125-126 cm | 33.86 | 1.92 | |
| 503A-10H-1, 4-8 cm | 37.06 | 2.07 | |
| 503A-11H-1, 61-75 cm | 42.08 | 2.30 | |
| 503A-12H-2, 75-79 cm | 48.07 | 2.58 | |
| 503A-13H-3, 13-17 cm | 54.55 | 2.93 | |
| 503A-14H-2, 46-49 cm | 56.57 | 3.03 | |
| 503A-16-2, 100-103 cm | 65.92 | 3.39 | |
| 503A-19H-1, 27-30 cm | 76.88 | 3.76 | |
| 503A-21H-1, 33-47 cm | 85.8 | 4.06 | |
| 503A-23H-1, 41-44 cm | 94.63 | 4.35 | |
| 503A-24H-CC, 21-24 cm | 102.7 | 4.62 | |
| 503A-27H-1, 25-29 cm | 112.07 | 5.03 | |
| 503A-31H-2, 78-82 cm | 131.7 | 5.65 | |
| 503A-36H-1, 21-24 cm | 151.63 | 6.04 | |
| 503A-39-2, 122-136 cm | 167.39 | 6.50 | |
| 503A-44H-3, 70-73 cm | 190.31 | 6.84 | |
| 503A-47H-1, 124-129 cm | 201.06 | 7.11 | |
| 503A-52H-3, 65-68 cm | 225.46 | 7.96 | |
Table 2: Samples, core-depths and ages of samples at DSDP Sites 502, 502A, 502B, and 503 and 503A. All ages follow the biogeochronology of et alii (1995). Samples with an asterisk (*) were split-weighted (see text for explanation).
Note: Convention for specimen identification used in this study.
Each specimen was given a 15 character identification number, which encodes the sample name, the orientation, the number of the square in the faunal slide and the number of specimens in each square (see for example the specimen identification number indicated in
Figure 5 ![]() ). The first 4 characters indicate the Site, the next 2 characters identify the core, then follows the section (1 digit), the interval in cm (3 digits), the orientation (1 character, where K stands for keel position), then the field number in the faunal slide (2 digits), and the specimen ID per field (2 digits, numbered from left to right and from top to bottom).
). The first 4 characters indicate the Site, the next 2 characters identify the core, then follows the section (1 digit), the interval in cm (3 digits), the orientation (1 character, where K stands for keel position), then the field number in the faunal slide (2 digits), and the specimen ID per field (2 digits, numbered from left to right and from top to bottom).
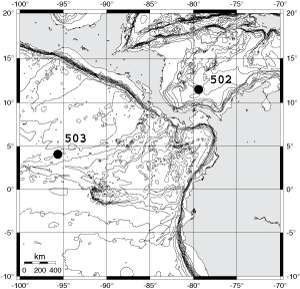
Click on thumbnail to enlarge the image.
Figure 1: Map (Mercator projection) showing the geographic location of DSDP holes 502, 502A, 502B and 503, 503A. The isobaths indicate ocean-floor contours at 500 m intervals. The map was created using the Online Map Creation tool, available from URL: http://www.aquarius.geomar.de/
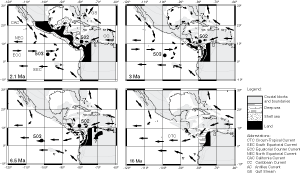
Click on thumbnail to enlarge the image.
Figure 2: Paleogeography of the Caribbean and eastern equatorial Pacific at 16 Ma, 6.5 Ma, 3 Ma and 2.1 Ma. Reconstruction of the location and bounds of crustal plates was done using the Advanced Plate Tectonic Reconstruction Service from the Ocean Drilling Stratigraphic Network homepage (URL: http://www.odsn.de/odsn/services/paleomap/adv_map.html). The palaeogeography is taken from et alii (1989), et alii (1992), & (1996), et alii (1996), (2000), and et alii (2003). Palaeocurrents are from & (1985), et alii (1995), and & (2000).
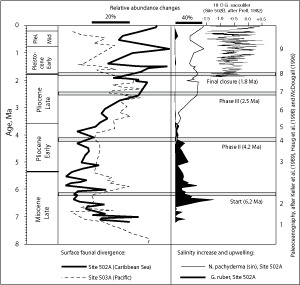
Click on thumbnail to enlarge the image.
Figure 3: Palaeoceanographic summary of the emergence of the Isthmus of Panama (after et alii, 1989; , 1996; et alii, 1998). Numbers on the right margin of the diagram concern palaeoceanographic events: 1). Benthic and planktic faunal provinces on either side of the ancient Central American seaway are similar (until 6.7 Ma (Caribbean) and 6.2 Ma (Pacific)). Before 5.6Ma: North Atlantic Deep Water (NADW) flowed across a rising sill into the Pacific. After 5.6 Ma: Deep water flows across the sill ended; 2). Before 4.6�4.5 Ma: Poor ventilation in the Caribbean and dissolution of the carbonate skeletons of plankton. Onset of upwelling in the Caribbean, disruption of intermediate water flow to Pacific. Siliceous microfossils are absent in sediments younger than 6 Ma; 3). Major upwelling in Caribbean; 4). Onset of increased salinity in the surface water of the Caribbean (4.6-4.2 Ma); 5). Increasing abundance of surface water species tolerant of high salinity; 6). Major intensification of Northern Hemisphere glaciation (3.3-2.9 Ma); 7). Permanent isolation of faunal provinces (drop in sea level, connection between Atlantic and Pacific very restricted); 8). Permanent closure of the seaway across the Isthmus of Panama, continued increase in the divergence of the assemblages of surface-dwelling plankton of the Pacific and Caribbean; 9). Major increase in the salinity of the Caribbean Sea. Pleistocene, right-hand column: Oxygen isotope curve for Globigerinoides sacculifer at DSDP Site 502B (, 1982).
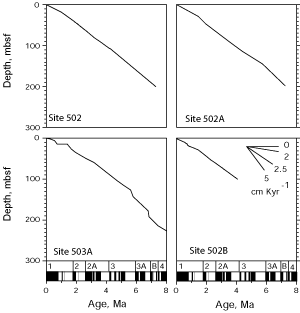
Click on thumbnail to enlarge the image.
Figure 4: Models of age used for dating samples from DSDP Sites 502, 502A, 502B, and 503A. These models are based on combined evidence of magnetic reversals, combined with first and last occurrences of planktonic foraminifera, coccoliths, radiolaria, and diatoms (see text). The curves follow the integrated biogochronology of et alii (1995). The black bars in the horizontal column at the bottom of the lower graphs indicate magnetic reversals (black: Normal polarity, white: Reversed polarity). The numbers above the magnetic reversals indicate magnetic chrons according to & (1995).
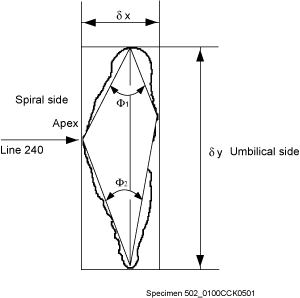
Click on thumbnail to enlarge the image.
Figure 5: Diagram illustrating the morphometric parameters measured in this study. The outline represents a menardiform globorotalid in keel position. During positioning the specimen was moved so that the apex of the shell coincided with the y-coordinate at 240 pixels of the 640x480 pixels imaging window of the Nih-Image. Abbreviations: ∂x = height of spire, ∂y = diameter of the test and its height in axial view, Φ1 = upper peripheral keel angle, Φ2 = lower peripheral keel angle.
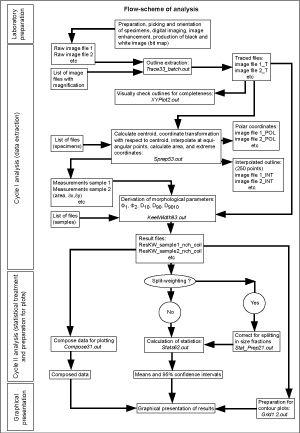
Click on thumbnail to enlarge the image.
Figure 6: Flow diagram of steps of the preparation, study, and classification of specimens and their interpretation in graphical form. The names of the Fortran 77 programs developed and used for this study end with the suffix '.out'. All program codes are listed and described in (2004).
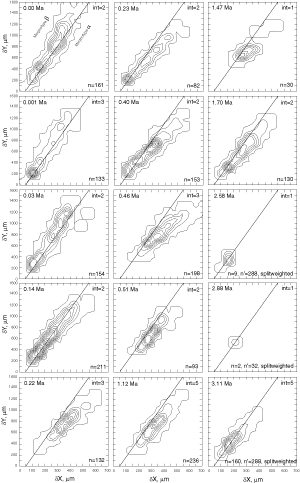
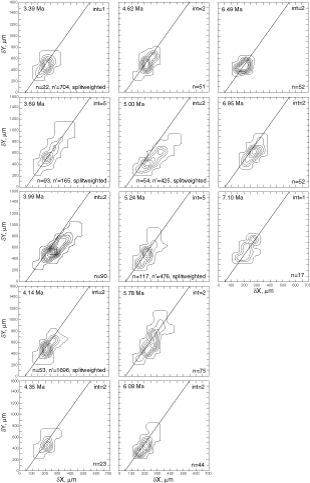
Click on thumbnail to enlarge the image.
Figure 7: Contoured bivariate frequency plots of ∂x vs ∂y showing the evolution of the menardiform morphotypes at DSDP Site 502A (Caribbean Sea). Frequencies were obtained by gridding and counting specimens per sample and grid-cell in ∂x vs ∂y scatter plots. Grid-cell size was Δ∂x=50µm and Δ∂y=100µm. Contour intervals (=int) are in numbers of specimens per grid cell as indicated in the upper right corner of each diagram. The n at the lower right corner indicates the total number of specimens included in each sample. The n'= indicates the number of specimens involved after splitweighting was performed (see text for further explanations). If no splitweighting was necessary, n'= does not appear. A diagonal line separates the morphospace occupied by morphotype alpha (below line) from that of morphotype beta (above line).
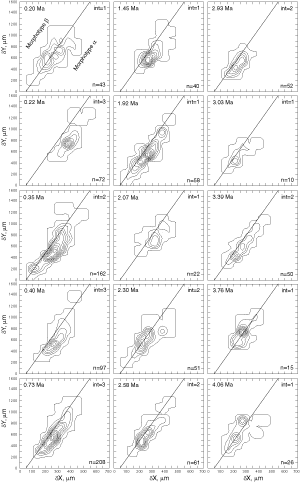
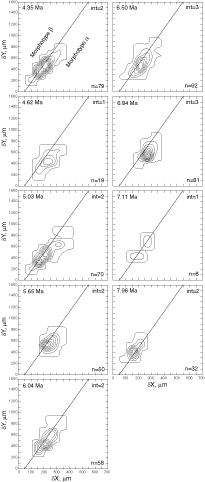
Click on thumbnail to enlarge the image.
Figure 8: Contoured bivariate frequency plots of ∂x vs ∂y of the G. menardii morphotypes at DSDP Site 503A (Eastern Equatorial Pacific). See caption of
Figure 7 ![]() for explanations.
for explanations.
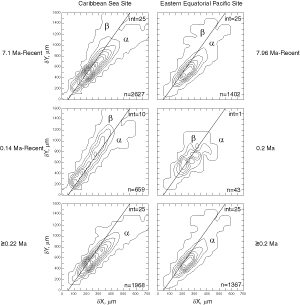
Click on thumbnail to enlarge the image.
Figure 9: Cumulated and contoured bivariate frequency distributions of G. menardii morphotypes in the ∂x vs ∂y space. They show the morphospaces occupied by morphotype alpha and morphotype beta. Caribbean Sea samples are in the panels on the left side, Eastern Equatorial Pacific samples are in the panels on the right. The top row depicts the frequency distributions of all the individuals measured. They range in age from 8 Ma to the Quaternary. The middle row includes only upper Pleistocene samples (i.e. those younger than 0.22 Ma). The lower row represents samples older than and up to 0.22 Ma. The line separates morphotypes alpha (a) from beta (b) and has the same coordinates as those of
Figures 7 ![]() and 8
and 8 ![]() . Gridding too is the same as that of
Figures 7
. Gridding too is the same as that of
Figures 7 ![]() and 8
and 8 ![]() . Contour intervals
(=int) are indicated on the upper right corner of each diagram (specimens per grid-cell). The number on the lower right corner of each diagram (n) indicates the number of specimens included.
. Contour intervals
(=int) are indicated on the upper right corner of each diagram (specimens per grid-cell). The number on the lower right corner of each diagram (n) indicates the number of specimens included.
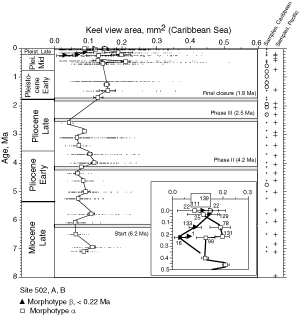
Click on thumbnail to enlarge the image.
Figure 10: Diagram showing the evolution of the mean surface areas in keel view of morphotype alpha (open squares) and morphotype beta (black triangles) at DSDP Site 502, 502A, and 502B. Small dots indicate the range of variation in the area of the keel views of individuals. Horizontal bars represent the span of the 95% univariate confidence level about the mean. Horizontal shaded bars are identical in placement to those of
Figure 3 ![]() and mark the major phases in the formation of the Isthmus of Panama. Small crosses on the right edge indicate the stratigraphic position in the succession and the
'degree of coverage' of samples from Site 502, A and B. Larger crosses indicate the
'coverage' at Site 503, A. Circles indicate samples with no Globorotalia menardii. The inset illustrates the evolution in mean size of morphotypes alpha and beta in the last 0.5 Ma during which the two morphotypes diverged. Morphotype beta developed its characteristics fully less than 0.22 Ma. The numbers posted next to each symbol are the number of specimens in that group.
and mark the major phases in the formation of the Isthmus of Panama. Small crosses on the right edge indicate the stratigraphic position in the succession and the
'degree of coverage' of samples from Site 502, A and B. Larger crosses indicate the
'coverage' at Site 503, A. Circles indicate samples with no Globorotalia menardii. The inset illustrates the evolution in mean size of morphotypes alpha and beta in the last 0.5 Ma during which the two morphotypes diverged. Morphotype beta developed its characteristics fully less than 0.22 Ma. The numbers posted next to each symbol are the number of specimens in that group.
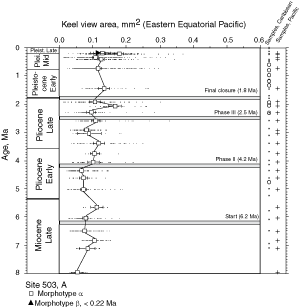
Click on thumbnail to enlarge the image.
Figure 11: Diagram showing the evolution of the mean surface area in keel view of morphotypes alpha (open squares) and beta (black triangles) at DSDP Site 503 and 503A. See caption of
Figure 10 ![]() for explanation.
for explanation.
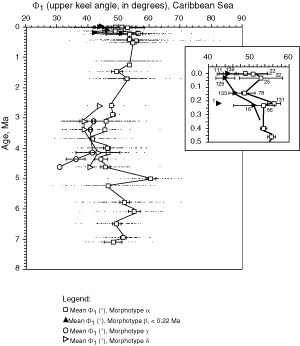
Click on thumbnail to enlarge the image.
Figure 12: Development of the mean of the upper keel angle Φ1 over time G. menardii: Open squares, morphotype alpha; filled triangles, morphotype beta; open circles, morphotype gamma and open triangles, morphotype delta at DSDP Site 502, 502A and 502B. Small dots indicate the range of measurements of individuals. Horizontal bars show the range of the 95% confidence level around the mean. Note that morphotypes gamma and delta tend to be flatter than specimens of G. menardii. The inset illustrates the separation of morphotypes beta from alpha during the past 0.5 Ma at this location (the numerals next to each symbol indicate the number of specimens included in each group).
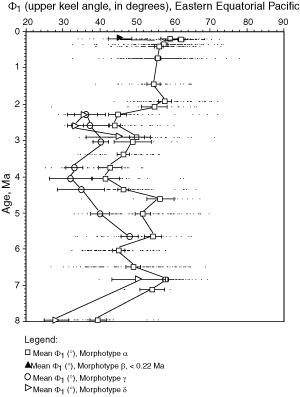
Click on thumbnail to enlarge the image.
Figure 13: Development of the mean upper keel angle Φ1 over time for morphotypes alpha, gamma and delta at DSDP Site 503 and 503A. Symbols are the same as in
Figure 12 ![]() .
.
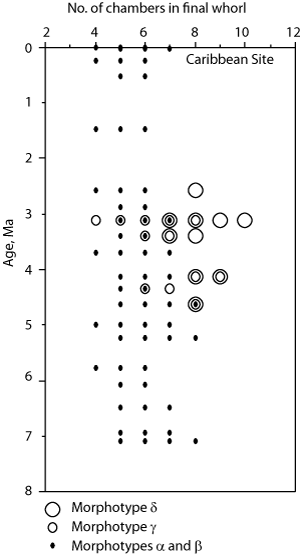
Click on thumbnail to enlarge the image.
Figure 14: Number of chambers in the final whorl of morphotypes alpha and beta (small ovals), morphotypes gamma (medium circles) and delta (large circles) over time at DSDP Sites 502, 502A and 502B.
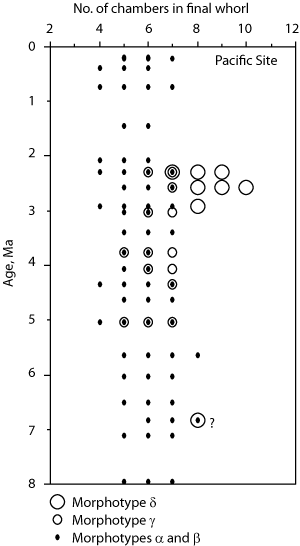
Click on thumbnail to enlarge the image.
Figure 15: Number of chambers in the final whorl of morphotypes alpha and beta, morphotypes gamma and delta over time at DSDP Site 503 and 503A. Symbols as in
Figure 14 ![]() .
.
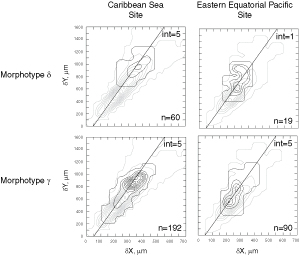
Click on thumbnail to enlarge the image.
Figure 16: In the lower panels, overlays of the range in size over time of morphotype gamma (black contours) on the 8 Ma to Recent morphospace of morphotype alpha (grey contours) in the Caribbean (left) and eastern Pacific (right) boreholes. In the upper panels, overlays of the range in size over time of morphotype delta (black contours) over the same grey contours of morphotype alpha that represent its ∂x versus ∂y morphospace as in the top row of
Figure 9 ![]() . The digits after n in the lower right corner of each box record the number of specimens of morphotypes gamma or delta used in making the contour map. The numbers after
(int=) in the upper right corner in each box indicate the contour interval (specimens per grid-cell). Gridding was at Δ∂x=50µm and Δ∂y=100µm. The diagonal lines that mark the boundary between the fields of morphotype beta and those of morphotype alpha during the Late Pleistocene (e.g. ≤ 0.22 Ma) and are shown only for comparison.
. The digits after n in the lower right corner of each box record the number of specimens of morphotypes gamma or delta used in making the contour map. The numbers after
(int=) in the upper right corner in each box indicate the contour interval (specimens per grid-cell). Gridding was at Δ∂x=50µm and Δ∂y=100µm. The diagonal lines that mark the boundary between the fields of morphotype beta and those of morphotype alpha during the Late Pleistocene (e.g. ≤ 0.22 Ma) and are shown only for comparison.
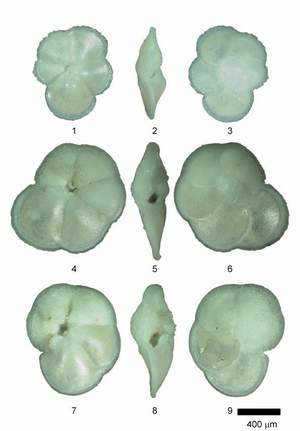
Click on thumbnail to enlarge the image.
Plate 1: Figures 1-3. Globorotalia fimbriata (morphotype beta with spines), umbilical, keel, and spire view, sample 502-1H-cc, 0-4cm, specimen 1901. Figures 4-6. Globorotalia menardii cultrata (morphotype beta), sample 502B-1-1, 2.5-4cm, specimen 1101. Figures 7-9. Globorotalia menardii menardii (morphotype alpha), sample 502A-2-3, 61.5cm, specimen 0603. Scale bar represents 400 µm and serves all specimens.
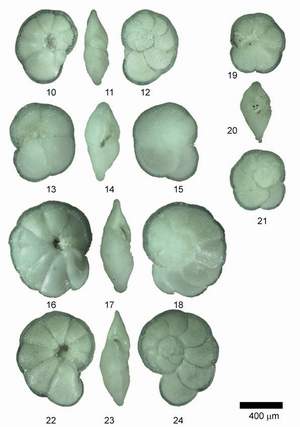
Click on thumbnail to enlarge the image.
Plate 2: Figures 10-12. Globorotalia limbata (morphotype gamma), sample 503A-11-1, 47.5cm, specimen 4201. Figures 13-15. Globorotalia menardii menardii (morphotype alpha), sample 502A-10H-1, 46-47cm, specimen 0505. Figures 16-18. Globorotalia multicamerata (morphotype delta), sample 502A-19H-2, 27-31cm, specimen 0202 (slide a). Figures 19-21. Globorotalia menardii menardii (morphotype alpha), sample 502A-32H-1, 35-39cm, specimen 0406. Figures 22-24. Globorotalia multicamerata (morphotype delta), sample 503A-11-1, 61-75cm, specimen 0602. Scale bar represents 400 µm and serves all specimens.