![]()
Contents
[1. Introduction] [2. Materiel and methods] [3. Results]
[Bibliographic references] [Appendix]
Service de Géologie, Faculté Polytechnique, Université de Mons, 20, Place du Parc, B-7000 Mons (Belgique)
Manuscript online since May 21, 2012
[Editor: Bruno ]
![]()
The Aïn Settara section (Kalaat Senan, central Tunisia) shows a continuous and well exposed marl-limestone alternation, extending from the Upper Maastrichtian to the basal Danian. The section reveals the superposition of several cycles, which correspond to the combined astro-climatic effect of both eccentricity and precession. Based on the ~100-kyr eccentricity and the ~21-kyr precession cycles, a floating chronometric scale is proposed. Thanks to this scale, the sedimentary and biological events of the section are dated with respect to the Cretaceous-Paleogene (K-Pg) boundary taken as the reference. Highlighting the very stable 405-kyr eccentricity cycle allows on one side to confirm the relevance of the established time scale and on the other side to determine the phase of this important signal with respect to the K-Pg boundary event.
Cretaceous-Paleogene boundary; Central Tunisia; marl-limestone alternation; cyclostratigraphy; time scale.
M. (2012).- Hunting for the 405-kyr eccentricity cycle phase at the Cretaceous-Paleogene boundary in the Aïn Settara section (Kalaat Senan, central Tunisia).- Carnets de Géologie [Notebooks on Geology], Brest, Article 2012/05 (CG2012_A05), p. 93-116.
Mise en évidence et détermination de la phase du cycle d'excentricité de 405 kyr par rapport à la limite Crétacé-Paléogène dans la coupe de l'Aïn Settara (Kalaat Senan, Tunisie centrale).- La coupe de l'Aïn Settara (Kalaat Senan, Tunisie centrale) expose d'une manière continue une alternance marno-calcaire qui s'étend du Maastrichtien supérieur au Danien basal. Cette coupe montre l'intrication de plusieurs cycles, qui correspondent à l'effet climatique combiné de l'excentricité de l'orbite terrestre et de la précession de l'axe de rotation de la Terre. À partir des cycles d'excentricité de ~100 ka et de précession de ~21 ka, une échelle chronométrique flottante a été construite. Grâce à cette échelle, les différents événements sédimentaires et biologiques de la coupe ont été datés par rapport à la limite Crétacé-Paléogène prise pour référence. La mise en évidence du cycle - réputé très stable - d'excentricité de 405 ka a permis d'une part de confirmer la justesse de l'échelle temps proposée et d'autre part de déterminer la phase de cet important cycle par rapport à l'événement de la limite Crétacé-Paléogène.
Limite Crétacé-Paléogène ; Tunisie centrale ; alternance marno-calcaire ; cyclostratigraphie ; échelle temps.
a. One exceptional horizon
The Mesozoic-Cenozoic boundary or Cretaceous-Paleogene boundary (= K-Pg boundary in this study) is well-known for the brutal disappearance of many groups of organisms. Some groups have completely disappeared; some other ones have been greatly affected. In the marine realm this phenomenon has been particularly studied with respect to the planktonic foraminifera (, 1977; , 1982), the calcareous nannofossils ( et al., 1982; et al., 1991) and the ammonites (, 1990; & , 1996). From a chemical point of view, the K-Pg boundary transition corresponds to a change in carbon-isotope composition of planktonic forams, but also to worldwide very high Ir concentration. This high Ir level, combined with the presence of sanidine spherules, shocked quartz, diamonds, Ni-rich spinel and tektites, leads to a bolide impact hypothesis ( et al., 1980; & , 1980). The Chicxulub hidden concentric-ring structure (Yucatan Peninsula, Mexico) is assigned to a major impact correlated with the K-Pg boundary event ( & , 1990; et al., 1991). Some other factors have probably also contributed to the K-Pg boundary transition like the Deccan flood basalts of India, and the big end-Cretaceous marine regression (, 1963; , 1972; , 1981).
This stratigraphic boundary nevertheless presents a unique character in the geological time scale, by its brevity, its worldwide character, the facility to be located in the field (at least in marine sections), and its unambiguous microscopic and geochemical characteristics. The importance of this boundary for the development of stratigraphy in general justifies the words of et al. (2006): "Evidently the K/T boundary interval marks the battleground in which the (geological) dating game will at least be partly decided."
b. A powerful tool
Marl-limestone alternations originate most of the time from astronomical forcing. This forcing induces climatic variations that trigger an alternation between the transfer of detrital argillaceous fraction, coming from the adjacent continental areas, and carbonate production, which are constituted by benthic and pelagic materials.
Lithological variations, induced by the variations of the parameters of Earth's orbit in the band (periods from about 20 to 400 kyr) have already been used to establish very precise time scales (, 1895; & , 1990; et al., 1993, 1999; & , 1995; , 1999; , 1999; et al., 1999; , 2000, 2004; et al., 2001, 2006; et al., 2003; et al., 2003; & , 2003; et al., 2004, 2005; et al., 2006; et al., 2006; & , 2007; et al., 2007, 2008; et al., 2009; et al., 2011).
Having identified both the precession (~20-kyr) and eccentricity (~100-kyr) cycles in the Aïn Settara section (central Tunisia), & (2003) used these cycles to build a detailed floating chronometric scale. They anchored it on the K-Pg boundary itself which was considered to be -65.0 Ma. The scale extending from -65.8 to -64.4 Ma covered a period of 1.4 Myr. It allowed dating sedimentary and biological phenomena present in the section, such as the end-Maastrichtian regression and the early Danian planktonic foraminifera biozones boundaries. However, the 405-kyr eccentricity cycle, which had not been identified by & (2003), is better than the ~20-kyr precession and the ~100-kyr eccentricity cycles, at establishing a reliable cyclostratigraphic-based scale: because of its higher stability (, 1999; et al., 2004, 2011) and its duration which is closer to the time scales usually used by geologists (biozones, magnetozones). It is thus more easily correlated with those scales.
et al. (1995) and & (1996, 1999) used the 405-kyr eccentricity cycle to establish a precise stratigraphic scale in the Late Triassic-Early Jurassic lake sedimentation of the Newark rift basin (Eastern North America). Other authors showed the interest of this 405-kyr cycle for Upper Cretaceous and Palaeocene stratigraphy ( et al., 1999; , 1999; et al., 2005; et al., 2007, 2008; et al., 2008; et al., 2011).
In this work, we present a new approach to highlight the presence of the 405-kyr cycle in the Aïn Settara section (central Tunisia) with the final aim of determining the cycle phase of the K-Pg boundary cosmic event. The recognition of the fuzzy interval type linked to the minima of the 100-kyr eccentricity cycle permits the determination of the location of the 405-kyr cycle. In favorable cases it is even possible to do this on short sections, to 1.5 times the 405-kyr period.
Palaeogeography
At the end of the Cretaceous the studied site was located on a distal marine ramp, at the limit between the Tethys Ocean and the Saharan Platform, just north of a frequently emerged area: "Kasserine Island" (Fig. 1 ![]() ; ,
1956; et al.,
1990). Maastrichtian-Danian plate tectonic models locate central Tunisia either on the northern tropics (which itself varies from 22° to 25° N according to the obliquity) or slightly southwards from the tropics (Fig. 1
; ,
1956; et al.,
1990). Maastrichtian-Danian plate tectonic models locate central Tunisia either on the northern tropics (which itself varies from 22° to 25° N according to the obliquity) or slightly southwards from the tropics (Fig. 1 ![]() ). The Kalaat Senan area calculated palaeolatitudes are: 19-20° N according to et al.
(1994), 18-19° N according to et al.
(1993), 24° to 24.5° N according to the Plate Tectonic Reconstruction Service of the Ocean Drilling Stratigraphic Network ( et al.,
1999).
). The Kalaat Senan area calculated palaeolatitudes are: 19-20° N according to et al.
(1994), 18-19° N according to et al.
(1993), 24° to 24.5° N according to the Plate Tectonic Reconstruction Service of the Ocean Drilling Stratigraphic Network ( et al.,
1999).
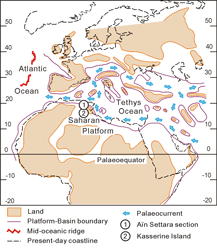
Click on thumbnail to enlarge the image.
Figure 1: Upper Maastrichtian - Lower Danian Western-Tethys palaeogeographic map (from et al., 1993; et al., 2001; modified).
The studied section
The area ranging between Kalaat Senan and Tajerouine (Fig. 2 ![]() ) exposes approximately 4500 m of limestones and marls, extending from the Lower Cretaceous (Aptian) to the Eocene (Ypresian; ,
1956; et al.,
1990). In this succession (Fig. 3A
) exposes approximately 4500 m of limestones and marls, extending from the Lower Cretaceous (Aptian) to the Eocene (Ypresian; ,
1956; et al.,
1990). In this succession (Fig. 3A ![]() ), the K-Pg boundary (boundary clay, planktonic foraminifera mass extinction, Ir anomaly, Ni-rich spinel level) is located at the first third of the ~600 m thick distal ramp marl-dominated El Haria Formation. This marly formation is framed, in the landscape, by the two prominent limestone bars of the Abiod (Campanian-Maastrichtian) and El Garia (Metlaoui Group, Ypresian)
formations.
), the K-Pg boundary (boundary clay, planktonic foraminifera mass extinction, Ir anomaly, Ni-rich spinel level) is located at the first third of the ~600 m thick distal ramp marl-dominated El Haria Formation. This marly formation is framed, in the landscape, by the two prominent limestone bars of the Abiod (Campanian-Maastrichtian) and El Garia (Metlaoui Group, Ypresian)
formations.
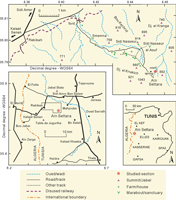
Click on thumbnail to enlarge the image.
Figure 2: Location of the Aïn Settara section.
The El Haria Formation consists of fissile marls, originally dark gray to black in color, that weathered over time to blue gray or brown gray. The microfauna is rich, diversified and mainly composed of planktonic and benthic foraminifera, and of ostracods. The macrofauna is rather poor, pyritised, often completely oxidised, and always small-sized. It primarily consists of bivalves, gastropods, solitary corals, and nuclei of ammonites (in the Cretaceous part of the section). These marls are considered to be monotonous, but occasionally comprise one-decimetre-thick, argillaceous limestone levels that are fine-grained, pale gray or beige, with a white patina. Bioturbation is frequent in the shape of burrows. In the marls, burrows are flattened by compaction. At certain levels, these marls are rich in jarosite concretions, a hydrous sulphate of potassium and iron coming from recent pyrite alteration.
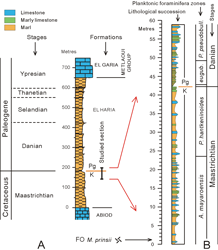
Click on thumbnail to enlarge the image.
Figure 3: Stratigraphical succession (from & 2003, modified). A. Regional frame (K-Pg = Cretaceous-Paleogene boundary). B. Detailed lithological succession and planktonic foraminifera biozones of the studied section. FO M. prinsii = First occurrence of the nannoplankton species Micula prinsii.
The El Haria Formation is well observed in the Oued Settara wadi ravine (World Geodetic System 1984 coordinates: 35.78577° N [35° 47' 08" N], 8.45390° E [8° 27' 14" E]), located 200 m east of the spring named Aïn Settara, approximately 12 km eastwards from the small town of Kalaat Senan, which is itself 55 km SSW of El Kef (Fig. 2 ![]() ). Deeply set in a narrow valley, the wadi cuts into sub-horizontal deposits ranging from the Upper Maastrichtian to the Lower Danian (Fig. 4
). Deeply set in a narrow valley, the wadi cuts into sub-horizontal deposits ranging from the Upper Maastrichtian to the Lower Danian (Fig. 4 ![]() ). The section is accessible and continuous over a thickness of ~100 m. The K-Pg boundary could be followed laterally along the western slope of the small valley over a distance of ~200 m. The K-Pg boundary of the Aïn Settara section has already been the subject of many publications
(e.g. et al., 1998; et al.,
2002; et al.,
2000a, 2000b; et al.,
2000; et al.,
2001; et al.,
2001; et al.,
2002; , 2002; et al.,
2002; & ,
2003; ,
2010).
). The section is accessible and continuous over a thickness of ~100 m. The K-Pg boundary could be followed laterally along the western slope of the small valley over a distance of ~200 m. The K-Pg boundary of the Aïn Settara section has already been the subject of many publications
(e.g. et al., 1998; et al.,
2002; et al.,
2000a, 2000b; et al.,
2000; et al.,
2001; et al.,
2001; et al.,
2002; , 2002; et al.,
2002; & ,
2003; ,
2010).
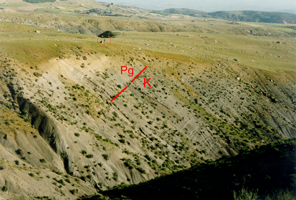
Click on thumbnail to enlarge the image.
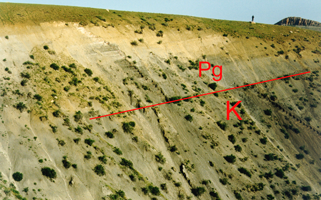
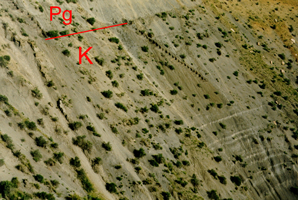
Figure 4: View on the western side of the Oued Settara where the Aïn Settara section is situated. The K-Pg boundary is located in red. The series has been sampled along two stair-like partial sections, one on the left for the Danian part, the other on the right for the Maastrichtian part. The series going from the bottom of the gully to the top of the slope makes about 60 m. A man in a red circle gives the scale.
The survey and sampling carried out cover ~60 m of the section outcropping along the gully slope from the thalweg of the Settara Wadi to the slope top (Fig. 3B ![]() ; & ,
2003). The lithological column was drawn on the basis of (1) a field survey of the "visual carbonate content" by combining rock colour (variations of gray) and hardness (relief or hollow, resistance to the hammer) and (2) the calcimetric measurements of 253 samples (an average of more than 4 per metre). As the sampling spacing was not sufficient to elaborate a satisfactory carbonate curve, the (continuous) visual curve obtained on the field was fitted to the (discontinuous) true calcimetric values ( & ,
2003, fig. 4).
; & ,
2003). The lithological column was drawn on the basis of (1) a field survey of the "visual carbonate content" by combining rock colour (variations of gray) and hardness (relief or hollow, resistance to the hammer) and (2) the calcimetric measurements of 253 samples (an average of more than 4 per metre). As the sampling spacing was not sufficient to elaborate a satisfactory carbonate curve, the (continuous) visual curve obtained on the field was fitted to the (discontinuous) true calcimetric values ( & ,
2003, fig. 4).
The K-Pg boundary is located thanks to the presence of the "boundary clay", a very dark, gray-brown clay level, 55 cm thick, marked at its base by the disappearance of the large-sized planktonic foraminifera that
are characteristic of the Upper Cretaceous. The K-Pg boundary cosmic markers (iridium anomaly and Ni-rich spinels) were found in a thin level (red clay layer) accompanied by flat jarosite nodules, gypsum and iron oxides ( et al.,
2000; et al.,
2001). The K-Pg boundary is situated at 42.22 m above the base of the studied section (Fig. 5 ![]() ).
).
Click on thumbnail to enlarge the image.
Figure 5: View on the upper part of the Aïn Settara section with the K-Pg boundary. The summit in the right is the Sidi Nasseur (914 m).
The position of the first occurrence of Micula prinsii , 1979, recorded by et al. (2000, fig. 50, p. 431) is situated about 1.20 m above the base of our section. The planktonic foraminifera biozonation used is that of et al. (1998) and et al. (2000a, 2000b). First occurrences of the taxa Plummerita hantkeninoides (, 1952), Parvularugoglobigerina longiapertura (, 1979), Parvularugoglobigerina eugubina ( & , 1964), Eoglobigerina simplicissima (, 1979), Parasubbotina pseudobulloides (, 1926) and Subbotina triloculinoides (, 1926) furnish excellent levels for comparisons with other sections and for worldwide correlations.
Ammonites occur in the Maastrichtian marls mainly as pyritous nuclei. The last ammonite found was located at 2.19 m below the K-Pg boundary (, 2010). In the Global Boundary Stratotype Section and Point (GSSP) of El Kef, the last ammonite was located at 2 m under the K-Pg boundary ( et al., 2004; , 2010).
Palaeodepth of the Aïn Settara deposits is only roughly estimated. et al. (2002) estimated the value to circa 30-60 m and qualifies the environment as: epicontinental sea, transition between the continental shelf and the slope shelf, or transition between inner and middle neritic. et al. (2002) gives circa 100-150 m, i.e. epicontinental sea, continental shelf, middle neritic. & (2002) suggest a deeper value of circa 200-300 m, i.e. open ocean, slope, upper bathyal.
Remark on the K-Pg boundary position in the Aïn Settara section
The Global Boundary Stratotype Section and Point (GSSP) for the Danian base was defined by the Cretaceous-Paleogene Working Group at the base of the boundary clay at a section close to the road to the Hammam Mellègue, near the town of El Kef. It was approved by the International Commission on Stratigraphy (ICS), ratified by the International Union of Geological Sciences (IUGS) in 1991 and later reconfirmed ( et al., 2006).
In the El Kef section, the planktonic foraminifera mass extinction, the Ir anomaly and the Ni-rich spinel level, occur exactly at the base of the boundary clay ( et al., 2006). On the other hand, in the Aïn Settara section, all three occur at a level situated 3 cm above the base of the boundary clay ( et al., 2001).
Question of the K-Pg boundary completeness in the Aïn Settara section
Some authors considered that the Aïn Settara section was not complete compared with those of El Kef and Ellès ( et al., 2002; , 2002) because of (1) the presence of burrows under the red clay layer, (2) the low thickness of the P0 planktonic foraminifera zone, (3) the existence, above the red clay layer, of a thin resedimented silt level.
Anyway, the presence in the thin red layer of enhanced Ir and Ni-rich spinel concentrations ( et al., 2001) proves the recording of the cosmic event itself, which would certainly have been removed in the case of significant reworking and erosion.
b. The astronomical tool
The astro-climatic signal
The solar flux that penetrates the top of the atmosphere undergoes cyclic variations related to the fluctuations of Earth's movement parameters: eccentricity, obliquity and precession (,
1941; , 1976,
1978a, 1978b; & ,
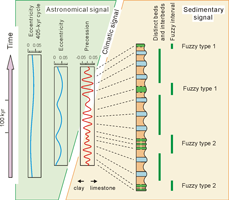
1991). The variations of these parameters (astronomical signal) trigger climatic variations (climatic signal) and thus sedimentary variations (sedimentary signal; Fig. 6 ![]() ). To clearly see the link existing between the astronomical, climatic and sedimentary signals, the first step is to examine the characteristics of the original signal as published by astronomers (,
1988; et al.,
1993,
2004, 2011; et al.,
2003).
). To clearly see the link existing between the astronomical, climatic and sedimentary signals, the first step is to examine the characteristics of the original signal as published by astronomers (,
1988; et al.,
1993,
2004, 2011; et al.,
2003).
Click on thumbnail to enlarge the image.
Figure 6: Model of the relation linking astronomical, climatic and sedimentary signals, particularly showing the link between precession and eccentricity cycles, and the deduced sedimentary product. & (2003), modified ; et al. (2009), modified.
Eccentricity
In spite of the proven chaotic behaviour of the solar system, eccentricity periods have only changed in a moderate way during the last 100 Ma (, 1990; et al., 2004). The Earth's orbit around the Sun is elliptic. Its shape (eccentricity) depends permanently on the movements of the other planets in the solar system (mainly Jupiter, Mars and Venus). Each planet has its own ecliptic plane defined by its orbit around the Sun. In the ecliptic plane, the major axis of each planetary orbit rotates relative to stars during a certain period. The rotational frequency of the major axis (secular frequency) of a planet is usually indicated by "g" plus an index identifying the planet position relative to the Sun. For example, g5 = 4.257564 arcsec/yr ( et al., 2004, Table 4) is the secular frequency of Jupiter. The Pg5 period is 304,399 yr. The period P is obtained from the frequency thanks to the formula: P(yr) = 1,296,000/ν (arcsec/yr). The Venus secular frequency g2 (= 7.456665 arcsec/yr) corresponds to a Pg2 period of 173,804 yr.
Click on thumbnail to enlarge the image.
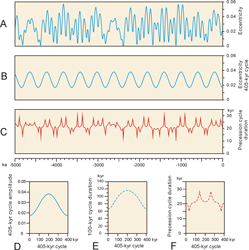
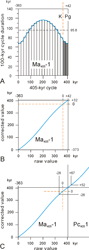
Figure 7: Prominent characteristics of the 405-kyr eccentricity cycle. A. Eccentricity amplitude during the last 5 Ma ( et al., 2004). B. Extracted 405-kyr eccentricity cycle. C. Precession cycle duration. D. 405-kyr eccentricity amplitude. E. Approximate duration of the ~100-kyr eccentricity cycle during the 405-kyr cycle. F. Typical curve of the evolution of the precession cycle duration along the 405-kyr cycle. It is only an example, depending on the phase difference between 100-kyr and 405-kyr cycles. C, D, E and F are recalculated according to the et al. (2004) solution.
The history of the eccentricity of the Earth's orbit (Fig. 7A ![]() ) is influenced by the interactions (beats) of the various secular frequencies. As an example, the strongest interaction corresponds to the beat of the secular frequencies of Venus and Jupiter (g2-g5), which results in a frequency of ~3.2 arcsec/yr, corresponding to a Pg2-g5 period of ~405 000 years ( et al.,
2004). Eccentricity also varies on periods that are close to 100 kyr. The most significant periods are ~95 kyr (g4-g5: Mars and Jupiter) and ~124 kyr (g4-g2: Mars and Venus; et al.,
2004).
) is influenced by the interactions (beats) of the various secular frequencies. As an example, the strongest interaction corresponds to the beat of the secular frequencies of Venus and Jupiter (g2-g5), which results in a frequency of ~3.2 arcsec/yr, corresponding to a Pg2-g5 period of ~405 000 years ( et al.,
2004). Eccentricity also varies on periods that are close to 100 kyr. The most significant periods are ~95 kyr (g4-g5: Mars and Jupiter) and ~124 kyr (g4-g2: Mars and Venus; et al.,
2004).
In fact, as the planets all interfere constantly with each other, these values are only averages (quasi-periods). The duration of the ~100-kyr cycle varies according to its temporal position with respect to the 405-kyr cycle (Fig. 7E ![]() ), from ~60-70 kyr when the amplitude of the long cycle is minimal, and ~110-120 kyr when the amplitude is maximal (Fig. 7D
), from ~60-70 kyr when the amplitude of the long cycle is minimal, and ~110-120 kyr when the amplitude is maximal (Fig. 7D ![]() ; see also ,
1999). The overall average value of the ~100-kyr period is 95.8 kyr (,
1976).
; see also ,
1999). The overall average value of the ~100-kyr period is 95.8 kyr (,
1976).
Precession
Precession currently comprises two quasi-periods of approximately 19 and 23 kyr, the mean period is 21.74 kyr. Precession period varies according to the eccentricity with large peak variations which are not randomly distributed (Figs. 7C ![]() and 5F
and 5F ![]() ; see: & ,
1998; ,
2000). For the last 5 Ma, the minimum
period is of ~13.9 kyr and the maximum period of ~31.3 kyr (,
1976; et al.,
1992).
; see: & ,
1998; ,
2000). For the last 5 Ma, the minimum
period is of ~13.9 kyr and the maximum period of ~31.3 kyr (,
1976; et al.,
1992).
Long-term evolution of the precession periods
During geological times, average duration of the precession period did not remain constant. The lengthening of the day and of the Earth-Moon distance, as well as the reduction in the dynamic ellipticity of the Earth, over time, induced a lengthening of the fundamental astronomical periods for precession and obliquity ( & , 1994; et al., 1989a, 1989b). Values of the precession periods at -65.5 Ma, used in this work, were linearly interpolated according to those established, for 0 and -72 Ma ( & , 1994, Table 3). The interpolated mean-period of the precession corresponding to the K-Pg boundary is 21.3 kyr (Table 1).
|
Age (Ma)
|
0
|
-65.5
|
-72
|
| Quasi-period (kyr) | 23 (b) | 22.5 | 22.47 (b) |
| Average precession | 21.74 (a) | 21.3 | |
| Quasi-period (kyr) | 19 (b) | 18.7 | 18.63 (b) |
Table 1: Determination of the mean precession period for -65.5 Ma. (a) (1976); (b) & (1994).
Precession versus obliquity
Obliquity exerts a strong climatic influence at high latitudes, and a low one in the intertropical zone (, 1978a). That is especially true if the Earth lacks vast ice covers (, 1989). Although Upper Cretaceous was long regarded as ice-free, Maastrichtian-Danian most probably saw the development of occasional continental ice sheets ( & , 1999; et al., 1999, 2005; , 2003; et al., 2008; , 2008).
et al. (1985) suggested that
astronomical forcing caused changes in monsoons which in turn induces changes in Cretaceous sediment record. &
(1987) stated that precession rather than obliquity affected low- to mid-latitude monsoons, as often observed in the Cretaceous record. In this specific case, plate tectonics models locate central Tunisia close to the northern tropic at about 19-23° N (see
section 2.a; Fig. 1 ![]() ) in the
Maastrichtian-Danian. Therefore, precession triggered sedimentation variations. Obliquity will not be taken into account in the present work.
) in the
Maastrichtian-Danian. Therefore, precession triggered sedimentation variations. Obliquity will not be taken into account in the present work.
a. Stratonomy
The studied section (Fig. 3B ![]() ) shows a decimetric to metric marl-limestone alternation. One
end consists of thin, clear and slightly prominent more carbonated beds. The other
end is made of thicker, dark, slightly depressed and more argillaceous interbeds. Limestone beds are 0.10 to 0.35 m thick, whereas marly interbeds vary from 0.10 to 3 m.
) shows a decimetric to metric marl-limestone alternation. One
end consists of thin, clear and slightly prominent more carbonated beds. The other
end is made of thicker, dark, slightly depressed and more argillaceous interbeds. Limestone beds are 0.10 to 0.35 m thick, whereas marly interbeds vary from 0.10 to 3 m.
Click on thumbnail to enlarge the image.
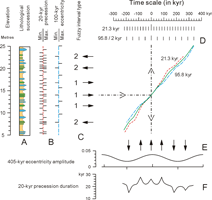
Figure 8: Cyclostratigraphic interpretation of a portion of the Aïn Settara section. A. Lithostratigraphic succession for the 5- to 25-metre interval. B. Determination of the minima and maxima of the precession cycle (red dashed) and of the ~100-kyr eccentricity cycle (blue dashed). C. Determination of the type of fuzzy intervals (minima of the ~100-kyr cycle). Arrows pointing to the right: 1-2 thick beds; arrows pointing to the left: 2-3 thin beds. D. A local (floating) time-scale. Red short dashed line = precession-based time curve; blue long dashed line = ~100-kyr-based time-curve; continuous green line = averaged time curve. E. Projection of the arrows (C) through the time-scale curve and approximate positioning of an idealised 405-kyr cycle. Upwards arrows: high portion of the 405-kyr cycle; downwards arrows: low portion of the 405-kyr cycle. F. Approximate precession cycle duration.
Marl-limestone alternation is particularly clear and regular in the 5 to 25 m interval of the section (Figs. 8A ![]() and 9
and 9 ![]() ; see also: & ,
2003, fig. 4). The lithologic curve is almost sinusoidal in shape,
i.e. the bed-interbed transitions are progressive and the beds are symmetrical.
Figure 8A
; see also: & ,
2003, fig. 4). The lithologic curve is almost sinusoidal in shape,
i.e. the bed-interbed transitions are progressive and the beds are symmetrical.
Figure 8A ![]() reveals that beds and interbeds are not randomly distributed. Indeed, an alternation of a lower order frame the marl-limestone alternation itself: one end shows sets of distinct thick beds and interbeds (in blue and orange on the figure) and, the other end shows more diffuse and thinner zones, called fuzzy intervals, that are more difficult to delimit as beds and interbeds (in green and orange; see Fig. 6
reveals that beds and interbeds are not randomly distributed. Indeed, an alternation of a lower order frame the marl-limestone alternation itself: one end shows sets of distinct thick beds and interbeds (in blue and orange on the figure) and, the other end shows more diffuse and thinner zones, called fuzzy intervals, that are more difficult to delimit as beds and interbeds (in green and orange; see Fig. 6 ![]() ).
).
Click on thumbnail to enlarge the image.
Figure 9: Close-up view on the Aïn Settara section with the K-Pg boundary. The image shows the ~3- to ~46-metre interval. The K-Pg boundary is situated at 42.22 m.
Sets of well-defined thick beds and interbeds show most of the time substantial differences in carbonate content. They are generally composed of two (or three) beds and of an equal number of interbeds. The fuzzy intervals are more difficult to characterise, because of the less obvious variations in carbonate content. We nevertheless manage to distinguish one to three "limestone beds" or more limy zones, separated by thin "interbeds" or slightly more argillaceous intervals. We can further distinguish two types of fuzzy intervals (Figs. 6 ![]() and 8C
and 8C ![]() ): some show one, sometimes two, relatively thick "beds" (type 1), others show three, sometimes two, thin "beds" (type 2).
): some show one, sometimes two, relatively thick "beds" (type 1), others show three, sometimes two, thin "beds" (type 2).
b. Cyclostratigraphic interpretation of the stratonomic characteristics
Observed characteristics of beds and interbeds (progressive boundaries, symmetrical aspect and absence of graded bedding) plead in favour of a sinusoidal signal rather than a discontinuous or jerked one (like in turbidites or tempestites). The astro-climatic assumption seems to be appropriate. In many studies devoted to palaeoenvironments similar to Aïn Settara, the
extremes between which the precession value oscillates are thought to correspond to variable climatic conditions favourable on one hand to the carbonate sedimentation and on the other hand to the transfer of clays (and of other siliciclastics) from the continent to the basin (Fig. 6 ![]() ; ,
1895; et al.,
1991; de & ,
1994; & ,
1995).
; ,
1895; et al.,
1991; de & ,
1994; & ,
1995).
The stratonomic frame described above presents analogies with precession triggered climatic signal (Fig. 6 ![]() ). Thus, if the beds and interbeds are supposed to correspond to the variation of the precession value with a period of ~20 kyr, then, alternation of distinct beds and interbeds and fuzzy intervals corresponds to the amplitude modulation of the precession by eccentricity with a period of ~100 kyr. Zones with clear beds and interbeds would be allotted to periods of strong amplitude of the astro-climatic signal,
i.e. the periods of strong eccentricity. Diffuse zones or fuzzy intervals would be correlated to the periods of minimal eccentricity (Fig. 6
). Thus, if the beds and interbeds are supposed to correspond to the variation of the precession value with a period of ~20 kyr, then, alternation of distinct beds and interbeds and fuzzy intervals corresponds to the amplitude modulation of the precession by eccentricity with a period of ~100 kyr. Zones with clear beds and interbeds would be allotted to periods of strong amplitude of the astro-climatic signal,
i.e. the periods of strong eccentricity. Diffuse zones or fuzzy intervals would be correlated to the periods of minimal eccentricity (Fig. 6 ![]() ). This stratonomic characteristic makes it possible to recognise at the same time precession and ~100-kyr eccentricity, delineated by their minima and maxima positions (Fig. 8B
). This stratonomic characteristic makes it possible to recognise at the same time precession and ~100-kyr eccentricity, delineated by their minima and maxima positions (Fig. 8B ![]() ). This allows building a time scale based on constant cycle periods (Fig. 8D
). This allows building a time scale based on constant cycle periods (Fig. 8D ![]() ). It is thus possible to plot (starting from an arbitrarily chosen point) two cumulative time curves, using cycles of 21.3 kyr for precession (red short dashed line) and semi-cycles of 95.8 / 2 kyr for eccentricity (blue long dashed line). An average curve is plotted (green full line) which could be used, for example, to measure the time interval between two determined levels within the section. Based on the same principles as
Figure 8
). It is thus possible to plot (starting from an arbitrarily chosen point) two cumulative time curves, using cycles of 21.3 kyr for precession (red short dashed line) and semi-cycles of 95.8 / 2 kyr for eccentricity (blue long dashed line). An average curve is plotted (green full line) which could be used, for example, to measure the time interval between two determined levels within the section. Based on the same principles as
Figure 8 ![]() a chronometric scale is built for the entire section (Fig. 10
a chronometric scale is built for the entire section (Fig. 10 ![]() ).
).
Click on thumbnail to enlarge the image.
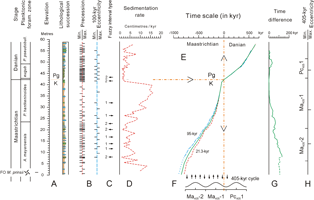
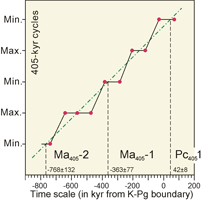
Figure 10: Cyclostratigraphic interpretation of the entire studied section. & (2003), modified. A. Stratigraphic column. B. Determination of the minima and maxima of the precession cycle and of the ~100-kyr eccentricity cycle. C. Determination of the fuzzy interval type (minima of the ~100-kyr cycle). D. Precession cycle-based (undecompacted) sedimentation rate. E. A local (floating) time-scale. Red short dashed line = precession-based time curve; blue long dashed line = ~100-kyr-based time curve; continuous green line = averaged time curve. F. Projection of the arrows (C) through the time-scale curve, and approximate positioning of an idealised 405-kyr cycle. Upwards arrows: high amplitude portion of the 405-kyr cycle; downwards arrows: low amplitude portion of the 405-kyr cycle. The notation of the cycles comes from et al. (2008). G. Time difference. Difference between ~100-kyr time-curve and 21.3-kyr time-curve. H. Projection of the (F) 405-kyr cycle.
Uncertainty of time values
The uncertainty of the values deduced from the averaged time curve originates from different causes. First, is the time difference between the eccentricity (95- kyr cycle) time curve and the precession (21.3-kyr cycle) time curve (Fig. 10G ![]() ). Second, the exact location of the K-Pg boundary in the Aïn Settara section suffers from a definition uncertainty due to (1) the separation (3 cm) between the base of the boundary clay and the Ir anomaly level, and (2) an, unlikely but possible, little hiatus or condensation could be present at that level. This linked uncertainty interval is estimated to a maximum of ±3 kyr,
i.e. a time range 6 kyr. Third, the interpretative approach suggests the possibility of underestimation or overestimation of the number of precession cycles present in the section. An uncertainty of ±4 precession cycles has been admitted between the K-Pg boundary and the base of the studied section (8 times 21.3 kyr = 170 kyr). The same ±4 cycles figure is also considered between the K-Pg boundary and the top of the studied section. As these different uncertainty figures have been added, the offered uncertainty values constitute maximized (pessimistic) values.
). Second, the exact location of the K-Pg boundary in the Aïn Settara section suffers from a definition uncertainty due to (1) the separation (3 cm) between the base of the boundary clay and the Ir anomaly level, and (2) an, unlikely but possible, little hiatus or condensation could be present at that level. This linked uncertainty interval is estimated to a maximum of ±3 kyr,
i.e. a time range 6 kyr. Third, the interpretative approach suggests the possibility of underestimation or overestimation of the number of precession cycles present in the section. An uncertainty of ±4 precession cycles has been admitted between the K-Pg boundary and the base of the studied section (8 times 21.3 kyr = 170 kyr). The same ±4 cycles figure is also considered between the K-Pg boundary and the top of the studied section. As these different uncertainty figures have been added, the offered uncertainty values constitute maximized (pessimistic) values.
c. Approximation of the precession and the 100-kyr eccentricity cycle phases
A reduced portion of the stratigraphic succession encompassing the K-Pg boundary is examined (Fig. 11 ![]() ). Curve "a" on
Figure 11A
). Curve "a" on
Figure 11A ![]() corresponds to the calcimetric analyses carried out on the samples. In addition to the traditional observation of a sharp decline in carbonate content and of the progressive "carbonate recovery", the curve reveals a superimposed oscillation. The detrended curve "b" is obtained by removing the effects of the sharp decline and of the progressive increase.
corresponds to the calcimetric analyses carried out on the samples. In addition to the traditional observation of a sharp decline in carbonate content and of the progressive "carbonate recovery", the curve reveals a superimposed oscillation. The detrended curve "b" is obtained by removing the effects of the sharp decline and of the progressive increase.
Click on thumbnail to enlarge the image.
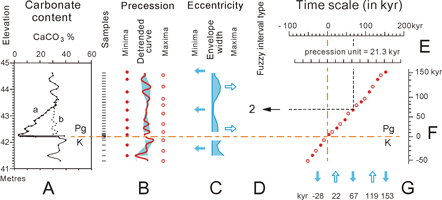
Figure 11: The chronometric scale in the K-Pg boundary vicinity and determination of the minima and maxima of the ~100-kyr cycle. A. Carbonate content: a = measured carbonate recovery curve, b = detrended carbonate curve. B. Detrended carbonate content curve. Minima (red filled circles) and maxima (red empty circles) of the curve are indicated. C. Width of the blue envelope curve (B). Minima (blue filled arrows) and maxima (blue empty arrows) of the ~100-kyr eccentricity cycle are indicated. D. Determination of the fuzzy interval type. E. The chronometric scale, based on arbitrarily chosen constant precession units. F. Projection of the chronometric scale in the vertical direction. G. Projection of the minima and maxima of the ~100-kyr eccentricity cycle on the chronometric scale.
In the Ellès Section, &
(2002) and
(2010) underscore very similar small-scale oscillations in the earliest Danian interval (see also for the El Kef section: et al.,
1998; et al.,
2004, 2005). The detrended curve "b" is reproduced in
Figure 11B ![]() , with full red circles representing minima positions and hollow red circles representing maxima positions. As already stated (Figs. 6
, with full red circles representing minima positions and hollow red circles representing maxima positions. As already stated (Figs. 6 ![]() , 8
, 8 ![]() and 10
and 10 ![]() ), the minima correspond to the precession minima and the maxima to the precession maxima. The envelope area (grayed) of the detrended curve shows nodes and bellies. This corresponds to modulation of the precession amplitude by eccentricity (Fig. 6
), the minima correspond to the precession minima and the maxima to the precession maxima. The envelope area (grayed) of the detrended curve shows nodes and bellies. This corresponds to modulation of the precession amplitude by eccentricity (Fig. 6 ![]() ). In
Figure 11C
). In
Figure 11C ![]() , the evolution of the width of the envelope area (amplitude modulation) allows to determine the positions of the ~100-kyr
eccentricity cycle minima and maxima (large blue arrows).
, the evolution of the width of the envelope area (amplitude modulation) allows to determine the positions of the ~100-kyr
eccentricity cycle minima and maxima (large blue arrows).
As already shown in Figures 8 ![]() and 10
and 10 ![]() , the chronometric scale can be built by using the precession cyclicity.
Figure 11E
, the chronometric scale can be built by using the precession cyclicity.
Figure 11E ![]() depicts an arbitrary precession scale, which makes it possible to
correlate the field observations with an arbitrary time scale. Assuming a period of 21.3 kyr for the average precession, a floating chronometric scale is obtained. It is vertically projected in
Figure 11F
depicts an arbitrary precession scale, which makes it possible to
correlate the field observations with an arbitrary time scale. Assuming a period of 21.3 kyr for the average precession, a floating chronometric scale is obtained. It is vertically projected in
Figure 11F ![]() . In this case, the minima of the precession cycle closest to the K-Pg boundary fall at circa -17.2±5.0 kyr and +4.1±3.0 kyr
(Table 2).
. In this case, the minima of the precession cycle closest to the K-Pg boundary fall at circa -17.2±5.0 kyr and +4.1±3.0 kyr
(Table 2).
|
Cycle
|
Last Cretaceous minimum (in kyr) | First Paleogene minimum (in kyr) | Total cycle duration (in kyr) |
|
405-kyr raw (Fig. 13 405-kyr corrected (Fig. 14 |
-363±77 -373±74 |
+42±8 +32±6 |
405 405 |
|
~100-kyr raw (Fig. 11 ~100-kyr corrected (Fig. 14 |
-28±5 -26±5 |
+67±11 +52±9 |
95 78 |
|
~21-kyr (Fig. 11 ~21-kyr probable value |
-17.2±5.0 -15.0±5.0 |
+4.1±3.0 +3.6±3.0 |
21.3 (Table 1) ~17-20 |
Table 2: Location of the minima of the different cycles with respect to the K-Pg boundary in the Aïn Settara section.
Minima and maxima positions of the ~100-kyr eccentricity on the chronometric scale are shown in
Figure 11G ![]() . The two minima the closest to the K-Pg boundary are situated at circa -28±5 kyr and +67±11 kyr
(Table 2). These minima correspond to a period duration of 95 kyr, which appears to be close to the average value of 95.8 kyr (,
1976). The maxima that follow the K-Pg boundary (+22±5 kyr and +119±17 kyr) give a period of 97 kyr.
. The two minima the closest to the K-Pg boundary are situated at circa -28±5 kyr and +67±11 kyr
(Table 2). These minima correspond to a period duration of 95 kyr, which appears to be close to the average value of 95.8 kyr (,
1976). The maxima that follow the K-Pg boundary (+22±5 kyr and +119±17 kyr) give a period of 97 kyr.
The measured period values seem to show that the Aïn Settara succession must be essentially complete in the K-Pg boundary vicinity. Any lag in the sedimentary record should not, represent more than ~3 kyr.
d. Biostratigraphic testing of the time scale
Several important taxa were located in the Aïn Settara section, which will be used to test the reliability of the time-scale: the nannofossil Micula prinsii from et al.
(2000) and the planktonic foraminifera Plummerita hantkeninoides (), Parvularugoglobigerina longiapertura (), Parvularugoglobigerina eugubina (& ), Eoglobigerina simplicissima (), Parasubbotina pseudobulloides (), Subbotina triloculinoides (), studied by et al.
(1998) and et al.
(2000a, 2000b). Figure 12 ![]() shows the first
occurrence of the taxa with respect to the K-Pg boundary, obtained from the literature, plotted as a function the floating time-scale and compared with the averaged time-curve (green) from
Figures 10
shows the first
occurrence of the taxa with respect to the K-Pg boundary, obtained from the literature, plotted as a function the floating time-scale and compared with the averaged time-curve (green) from
Figures 10 ![]() (A) and 11
(A) and 11 ![]() (B).
(B).
Click on thumbnail to enlarge the image.
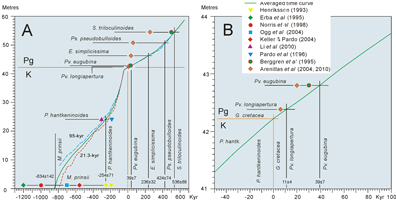
Figure 12: First
occurrence of different taxa from the literature plotted as a function the floating time-scale, compared with the averaged time-curve from Figures
10 ![]() (A) and
11
(A) and
11 ![]() (B). K-Pg = Cretaceous-Paleogene boundary; M. = Micula; P.= Plummerita; G.= Guembelitria; Pv.= Parvularugoglobigerina; E.= Eoglobigerina; Ps.= Parasubbotina; S.= Subbotina.
(B). K-Pg = Cretaceous-Paleogene boundary; M. = Micula; P.= Plummerita; G.= Guembelitria; Pv.= Parvularugoglobigerina; E.= Eoglobigerina; Ps.= Parasubbotina; S.= Subbotina.
The calcareous nannofossil Micula prinsii is often used to recognise the existence of the "uppermost Maastrichtian" (zone CC26b). The FO (first occurrence) of M. prinsii was located in the Aïn Settara section at the STW 40-metres level ( et al., 2000, fig. 50) which corresponds to a level located ~1.20 m above the zero of the present survey. According to (1993) M. prinsii appeared before the K-Pg boundary: 250 kyr in the South Atlantic, 220 kyr in the North Atlantic, and 190 kyr in the North Pacific. et al. (1995, fig. 1) give a value of ~1.2 Myr between the FO of M. prinsii and the K-Pg boundary. et al. (1998, Table 2, fig. 5) use the value of ~1 Myr before the K-Pg boundary, but do not explain how it has been determined. According to et al. (2004) the FO of M. prinsii is situated 700 kyr before K-Pg boundary. For (2002), the FO of M. prinsii was probably diachronous. Irrespective of the values due to (1993), the apparition of M. prinsii in the Aïn Settara section 834±142 kyr before the K-Pg boundary is consistent with data from the literature.
The P. hantkeninoides biozone which ends at the K-Pg boundary was introduced by et al. (1996) who evaluated the biozone duration to 170-200 kyr in the Agost section by using a sedimentation rate average of 2 cm/kyr for the part of the C29r magnetozone that is located under the K-Pg boundary. et al. (2000) estimated this duration to 300 kyr. Our -254±71 kyr value is also consistent. The FO of the Danian foraminifera Pv. longiapertura (11±4 kyr) and Pv. eugubina (39±7 kyr) are quite consistent with the data of et al. (1995) and et al. (2004, 2010).
The value of 536±88 kyr obtained for Subbotina triloculinoides match the et al. (1995) figure, but not that of et al.. The taxa E. simplicissima (236±32 kyr) and Ps. pseudobulloides (424±74 kyr) give very different figures. Despite this discrepancy, the FO of the Maastrichtian M. prinsii and P. hantkeninoides taxa and of the Danian Pv. longiapertura and Pv. eugubina taxa shows that the time scale is quite reliable in this time interval and that the significant change in sedimentation rate on both sides of the K-Pg boundary is also reliable. The post-eugubina part of the Danian remains questionable without further representative data.
e. Implications for sedimentation
Suppressing the ~100-kyr oscillations in Figure
10D ![]() could give a smooth curve, which would highlight the longer-term sedimentation variation. The figure shows that sedimentation rate vary to a ratio of 1:8.5. The value seems to be very high. In the Abiod Formation of the Ellès section (Campanian-Maastrichtian of Central Tunisia) the not-decompacted sedimentation-rate ratio between limestone members (Haraoua and Ncham) and marly members (Akhdar) varies from 1:2 to 1:4 ( et al.,
2009). In the Aïn Settara section, sedimentation rate decreases initially to a minimum located at approximately 15-m in the lithological column (-530±105 kyr), increases at about 25-30 m (-240±68 to -140±38 kyr), passes by a maximum at about 36-38 m (-80±19 to -70±17 kyr), and finally falls at about 40-41 m (-50±9 to -40±7 kyr), i.e. more than one metre under the K-Pg boundary (located at 42.22 m). The sedimentation rate remains rather low from 41 to 47 m (-40±7 to +280±37 kyr), then gradually goes up.
could give a smooth curve, which would highlight the longer-term sedimentation variation. The figure shows that sedimentation rate vary to a ratio of 1:8.5. The value seems to be very high. In the Abiod Formation of the Ellès section (Campanian-Maastrichtian of Central Tunisia) the not-decompacted sedimentation-rate ratio between limestone members (Haraoua and Ncham) and marly members (Akhdar) varies from 1:2 to 1:4 ( et al.,
2009). In the Aïn Settara section, sedimentation rate decreases initially to a minimum located at approximately 15-m in the lithological column (-530±105 kyr), increases at about 25-30 m (-240±68 to -140±38 kyr), passes by a maximum at about 36-38 m (-80±19 to -70±17 kyr), and finally falls at about 40-41 m (-50±9 to -40±7 kyr), i.e. more than one metre under the K-Pg boundary (located at 42.22 m). The sedimentation rate remains rather low from 41 to 47 m (-40±7 to +280±37 kyr), then gradually goes up.
These drastic changes in sedimentation rate could be explained by eustatic variations. Many authors saw a significant final Cretaceous regression, followed by a transgressive cycle at the base of the Paleogene (, 1987, 1992; et al., 1987). According to & (1996) and & (1996) the regression begins rather high in the A. mayaroensis biozone and reaches a maximum at the base of the P. hantkeninoides biozone. So, the higher half of the latter biozone is already definitely transgressive. et al. (2000) placed the low level just below the P. hantkeninoides biozone, which means that the transgression begins at the biozone base. (1997) proposes a relative variation curve of the sea level for eastern Denmark, showing that the final-Maastrichtian regression and the following transgression are located slightly under the K-Pg boundary. & (1999, fig. 11) admit that the regression culminates towards the end of the Maastrichtian, but that the K-Pg boundary itself is located in the transgression.
As data concerning the regional tectonic evolution are lacking for the time scale of this study, sedimentation rate variations will be considered here to follow eustatic variations. The large rise in sedimentation rate would thus correspond to a forced regression ( et al.,
1992; & ,
2000; & ,
2000), beginning at the base of the P. hantkeninoides biozone (Fig. 10D ![]() ). It could be due to a fall in the base level, which increases continental erosion and remobilizes sediments deposited onto the proximal ramp. As the studied section belongs to a rather deep depositional environment, it does not show any erosion surface, but on the contrary a large increase in sedimentation rate. The forced regression would begin about -400±70 to -300±73 kyr before the K-Pg boundary and would reach its maximum at about -100±24 to -80±19 kyr. Conversely, the major reduction in sedimentation rate (1 to 2 m under the K-Pg boundary) could correspond to the following transgression, which would begins around -50±9 kyr and abruptly slow down the sediment transfer towards the deeper
parts of the basin. The K-Pg boundary event occurs in this transgressive context.
). It could be due to a fall in the base level, which increases continental erosion and remobilizes sediments deposited onto the proximal ramp. As the studied section belongs to a rather deep depositional environment, it does not show any erosion surface, but on the contrary a large increase in sedimentation rate. The forced regression would begin about -400±70 to -300±73 kyr before the K-Pg boundary and would reach its maximum at about -100±24 to -80±19 kyr. Conversely, the major reduction in sedimentation rate (1 to 2 m under the K-Pg boundary) could correspond to the following transgression, which would begins around -50±9 kyr and abruptly slow down the sediment transfer towards the deeper
parts of the basin. The K-Pg boundary event occurs in this transgressive context.
f. Hunting for the 405-kyr cycle
In order to highlight the 405-kyr cycle in Figure
8C ![]() , arrows pinpoint the fuzzy intervals of the section,
i.e. the minima of the ~100-kyr eccentricity cycle. An arrow towards the right indicates a type-1 fuzzy interval (one, sometimes two, relatively thick beds). An arrow towards the left indicates a type-2 fuzzy interval (three, sometimes two, thin beds). The arrows are then projected on the time scale (Fig. 8E
, arrows pinpoint the fuzzy intervals of the section,
i.e. the minima of the ~100-kyr eccentricity cycle. An arrow towards the right indicates a type-1 fuzzy interval (one, sometimes two, relatively thick beds). An arrow towards the left indicates a type-2 fuzzy interval (three, sometimes two, thin beds). The arrows are then projected on the time scale (Fig. 8E ![]() ). The arrows pointing up thus indicate the minima of the ~100-kyr eccentricity, which correspond to a strong 405-kyr eccentricity. The arrows pointing down correspond to a low 405-kyr eccentricity. A sinusoidal cyclicity arbitrarily fixed at 405 kyr is adjusted to correspond as well as possible to the arrows (Fig. 8E
). The arrows pointing up thus indicate the minima of the ~100-kyr eccentricity, which correspond to a strong 405-kyr eccentricity. The arrows pointing down correspond to a low 405-kyr eccentricity. A sinusoidal cyclicity arbitrarily fixed at 405 kyr is adjusted to correspond as well as possible to the arrows (Fig. 8E ![]() ). An approximate variation curve of the precession cycle duration (Fig. 8F
). An approximate variation curve of the precession cycle duration (Fig. 8F ![]() ) is added. It shows how precession-cycle duration varies with time and causes fuzzy intervals of type 1 or type 2 to take place.
) is added. It shows how precession-cycle duration varies with time and causes fuzzy intervals of type 1 or type 2 to take place.
In Figure 10 ![]() , established on the whole section, the 405-kyr cyclicity is indicated in the same way as in
Figure 8
, established on the whole section, the 405-kyr cyclicity is indicated in the same way as in
Figure 8 ![]() using arrows. An arbitrarily-fixed 405-kyr cycle is also shown (Fig. 10F
using arrows. An arbitrarily-fixed 405-kyr cycle is also shown (Fig. 10F ![]() ). The notations Ma405-1 and Pc4051 are taken from et al.
(2008). They correspond respectively to the last mainly Maastrichtian 405-kyr cycle and to the first Palaeocene cycle. Owing to a possible lack of reliability of the time-scale for the post-eugubina Danian interval, the fuzzy interval type has not been investigated in the higher part of the section.
). The notations Ma405-1 and Pc4051 are taken from et al.
(2008). They correspond respectively to the last mainly Maastrichtian 405-kyr cycle and to the first Palaeocene cycle. Owing to a possible lack of reliability of the time-scale for the post-eugubina Danian interval, the fuzzy interval type has not been investigated in the higher part of the section.
Click on thumbnail to enlarge the image.
Figure 13: Determination of the minima positions of the 405-kyr cyclicity on the averaged chronometric scale. K-Pg = Cretaceous-Paleogene boundary.
Figure 13 ![]() shows the position of the minima and maxima duration peaks of the ~20-kyr cycle period according to the chronometric scale built in
Figure 10
shows the position of the minima and maxima duration peaks of the ~20-kyr cycle period according to the chronometric scale built in
Figure 10 ![]() . The vertical axis scale uses a constant step to represent the minima and maxima of the 405-kyr cycle. The regression line (green dash-dot line) gives the best fit link between the chronometric scale and the 405-kyr cycle. This line fulfills two criteria:
. The vertical axis scale uses a constant step to represent the minima and maxima of the 405-kyr cycle. The regression line (green dash-dot line) gives the best fit link between the chronometric scale and the 405-kyr cycle. This line fulfills two criteria:
Because the regression line intercepts the horizontal segments, it also cuts the oblique segments. Thus, the passage from a minimum peak of precession cycle duration to a maximum peak corresponds to the passing from the low values to the high values of the 405-kyr cycle (Fig. 7 ![]() ).
).
The projection lines (black dashed) give the positions of the minima of the 405-kyr cycle on the floating chronometric scale (Fig. 10 ![]() ). These minima values are -768±132 kyr, -363±77 kyr and +42±8 kyr
(Table 2). However, slightly different minima values could also be obtained by slightly translating the regression line, as the new lines still
fulfill criteria 1 and 2.
). These minima values are -768±132 kyr, -363±77 kyr and +42±8 kyr
(Table 2). However, slightly different minima values could also be obtained by slightly translating the regression line, as the new lines still
fulfill criteria 1 and 2.
g. Correlation potential of the peaks of precession cycle duration
Minima of the ~100-kyr eccentricity cycle correspond either to a minimum or to a maximum of precession cycle duration depending on their position in the 405-kyr cycle (Fig. 7C ![]() ). The number of consecutive minima or maxima peaks varies between one and three. Identifying the succession of minima and maxima peaks could help to correlate several sections since this succession depends directly on the astronomical signal itself. Thus,
Figure 13
). The number of consecutive minima or maxima peaks varies between one and three. Identifying the succession of minima and maxima peaks could help to correlate several sections since this succession depends directly on the astronomical signal itself. Thus,
Figure 13 ![]() shows that starting from the K-Pg boundary, the minima of the ~100-kyr cycle corresponds successively to the following peaks of precession cycle duration: one minimum, two maxima, two minima, three maxima. This succession, if recognised in other sections, would make it possible to precisely identify the minima of the ~100-kyr cycle. This correlation tool would be particularly useful for the "uppermost Maastrichtian" which has several hundreds of kyr biozones of planktonic foraminifera (Plummerita hantkeninoides) and of calcareous nannofossils (Micula prinsii)
(see section 3.e).
shows that starting from the K-Pg boundary, the minima of the ~100-kyr cycle corresponds successively to the following peaks of precession cycle duration: one minimum, two maxima, two minima, three maxima. This succession, if recognised in other sections, would make it possible to precisely identify the minima of the ~100-kyr cycle. This correlation tool would be particularly useful for the "uppermost Maastrichtian" which has several hundreds of kyr biozones of planktonic foraminifera (Plummerita hantkeninoides) and of calcareous nannofossils (Micula prinsii)
(see section 3.e).
h. Correction for variations in ~100-kyr cycle duration
As a reminder, the floating time scale obtained in Figure
10 ![]() is based on constant duration of the precession and of the ~100-kyr eccentricity periods. However, these periods vary according to the position in the 405-kyr cycle (Fig.
7 E
is based on constant duration of the precession and of the ~100-kyr eccentricity periods. However, these periods vary according to the position in the 405-kyr cycle (Fig.
7 E ![]() and F
and F ![]() ). As the time-curves obtained from both the precession and the ~100-kyr eccentricity (Fig. 10
). As the time-curves obtained from both the precession and the ~100-kyr eccentricity (Fig. 10 ![]() ) are very close to each other in the vicinity of the K-Pg boundary, the minima positions of the Ma405-1 cycle (encompassing the K-Pg boundary) have been modified by using the ~100-kyr cycle duration curve in
Figure 14A
) are very close to each other in the vicinity of the K-Pg boundary, the minima positions of the Ma405-1 cycle (encompassing the K-Pg boundary) have been modified by using the ~100-kyr cycle duration curve in
Figure 14A ![]() and its cumulative form in Figure 14B
and its cumulative form in Figure 14B ![]() . The 405-kyr minima values of -363±77 kyr and +42±8 kyr respectively become -373±74 kyr and +32±6 kyr
(Table 2). The same approach is used in Figure
14C
. The 405-kyr minima values of -363±77 kyr and +42±8 kyr respectively become -373±74 kyr and +32±6 kyr
(Table 2). The same approach is used in Figure
14C ![]() in order to correct the minima locations of the ~100-kyr cycle encompassing the K-Pg boundary
(Table 2).
in order to correct the minima locations of the ~100-kyr cycle encompassing the K-Pg boundary
(Table 2).
Click on thumbnail to enlarge the image.
Figure 14: A. Principle of the correction of the 405-kyr minima locations depending on variations in the ~100-kyr cycle duration. B. Correction of the 405-kyr cycle minima locations using the cumulative form of the correction curve (blue). C. Correction of the ~100-kyr cycle minima locations.
For the ~21-kyr precession cycle, duration can only be roughly estimated as no reliable model exists for the variation of the precession cycle duration (Fig. 7 ![]() ). Following
Figure 11G
). Following
Figure 11G ![]() , the K-Pg boundary is located about halfway between a minimum of the ~100-kyr cycle (-28±5 kyr) and a maximum of the ~100-kyr cycle (+22±5 kyr). Moreover, in Figures
13
, the K-Pg boundary is located about halfway between a minimum of the ~100-kyr cycle (-28±5 kyr) and a maximum of the ~100-kyr cycle (+22±5 kyr). Moreover, in Figures
13 ![]() and 14
and 14 ![]() , the K-Pg boundary is located close to a minimum of the 405-kyr cycle (+42±8 / +32±6 kyr). Based on these data (Fig. 7C
, the K-Pg boundary is located close to a minimum of the 405-kyr cycle (+42±8 / +32±6 kyr). Based on these data (Fig. 7C ![]() ), the actual K-Pg boundary precession cycle duration is estimated around 17-20 kyr
(Table 2).
), the actual K-Pg boundary precession cycle duration is estimated around 17-20 kyr
(Table 2).
a) The Aïn Settara section exposes a continuous marl-limestone alternation from the upper part of the Maastrichtian to the basal Danian.
b) The Aïn Settara succession revealed the superposition of several modes of alternation, corresponding to the combined astro-climatic signal of eccentricity and precession. Based on the ~100-kyr eccentricity cycle and the ~21-kyr precession cycle, a floating chronometric scale has been built (Fig. 10 ![]() ). Minima values of the ~100-kyr eccentricity have been found at -28±5 kyr and +67±11 kyr relative to the K-Pg boundary, corresponding to a period of 95 kyr (Fig. 11F
). Minima values of the ~100-kyr eccentricity have been found at -28±5 kyr and +67±11 kyr relative to the K-Pg boundary, corresponding to a period of 95 kyr (Fig. 11F ![]() ). Minima values of the precession have been determined at about -17.2±5.0 kyr and +4.1±3.0 kyr, assuming an average precession of 21.3 kyr (Fig. 11D
). Minima values of the precession have been determined at about -17.2±5.0 kyr and +4.1±3.0 kyr, assuming an average precession of 21.3 kyr (Fig. 11D ![]() ).
).
c) Previous estimates of the ages of the FO of the Maastrichtian M. prinsii and P. hantkeninoides taxa and of the Danian Pv. longiapertura and Pv. eugubina taxa shows that the time scale build is quite reliable in this time interval and that the significant change in sedimentation rate highlighted on both sides of the K-Pg boundary is also reliable. At the contrary, the post-eugubina Danian time interval is less clear. In return, if the chronometric scale is accepted it is then possible to date the various sedimentary and biological events occurring in the section with respect to the K-Pg boundary, e.g. the terminal Cretaceous regression, the following transgression, as well as the planktonic foraminifera biozone boundaries. The forced regression began about -400±70 to -300±73 kyr before the K-Pg boundary and reached its maximum at about -100±24 to -80±19 kyr. The subsequent transgression began towards -50±9 kyr. The K-Pg boundary event occurred in a transgressive context. The planktonic foraminifer P. hantkeninoides appeared 254±71 kyr before the K-Pg boundary. The calcareous nannofossil M. prinsii appeared 834±142 kyr before the K-Pg boundary.
d) The 405-kyr eccentricity cycle has been highlighted thanks to precession cycle-duration modulation linked to the minima of the 100-kyr eccentricity cycle (fuzzy interval type). It has confirmed the previously established time scale. The cycle has also been positioned with respect to the K-Pg boundary event. Its minima values are of -363±77 kyr and +42±8 kyr (Fig. 13 ![]() ). Taking into account the duration variation of the ~100-kyr cycle the values become respectively -373±74 kyr and +32±6 kyr.
). Taking into account the duration variation of the ~100-kyr cycle the values become respectively -373±74 kyr and +32±6 kyr.
e) In favorable cases the succession of minima and maxima peaks of precession cycle duration permits to determine the 405-kyr cycle even if the section is short, to 1.5 times the 405-kyr period. Moreover, it provides a finger print of specific stratigraphic interval and can be used to correlate different sections.
f) The determination of the accurate value of the phase of the well dated K-Pg boundary event with respect to the 405-kyr signal could be used as a valuable tool to improve the quality of Cenozoic Time Scale.
I first of all thank Christian (Faculty of Engineering of the University of Mons, Belgium), Etienne (Royal Belgian Institute of Natural Sciences, Brussels) and Mohedine (Kalaat Senan, Tunisia) for their assistance in the field. Eric (Laboratoire des Sciences du Climat et de l'Environnement, Gif-sur-Yvette, France) is thanked for fascinating field discussions on the K-Pg boundary event. Francis (Faculty of Engineering of the University of Mons) and Faouzi (Faculty of Science of Bizerte, Tunisia) are thanked for many profitable discussions on Tunisian geology. Field work in Tunisia was partly funded by the Belgian National Scientific Research Fund (Fond National de la Recherche Scientifique). Francis is also thanked for constructive comments on an earlier version of the manuscript. I am also indebted to Ms. Ramona (University of Mons) for improving the quality of the English. Thanks also go to the editor Bruno (Université de Bretagne Occidentale, Brest), the copy editor Christian C. , the proofreader Pierre , and three anonymous referees for critically reviewing the manuscript and offering many suggestions for its improvement.
T., G. & W. (2002).- Late Cretaceous to early Paleocene climate and sea-level fluctuations: the Tunisian record.- Palæogeography, Palæoclimatology, Palæoecology, Amsterdam, vol. 178, p. 165-196.
L, I., J.A. & E. (2002).- Eventoestratigrafía del límite Cretácico/Terciario en Aïn Settara (Tunicia): disminución de la productividad y oxigenación oceánicas.- Revista Mexicana de Ciencias Geológicas, Querétaro, vol. 19, n° 2, p. 121-136.
L.W., W., F. & H.V. (1980).- Extraterrestrial cause for the Cretaceous-Tertiary extinction.- Science, Washington, vol. 208, p. 1095-1108.
I. & J.A. (2000).- Parvularugoglobigerina eugubina type-sample at Ceselli (Italy): planktic foraminiferal assemblage and lowermost Danian biostratigraphic implications.- Rivista Italiana di Paleontologia e Stratigrafia, Milano, vol. 106, p. 379-390.
I., L., J.A. & E. (2000a).- Foraminíferos planctónicos y bentónicos del límite Cretácico/Terciario de Aïn Settara, Tunicia: dos patrones de extinción diferentes y una misma causa.- Geotemas (Sociedad Geológica de España), Salamanca, vol. 1, n° 2, p. 331-334.
I., J.A., E. & C. (2000b).- The Cretaceous/Paleogene (K/P) boundary at Aïn Settara, Tunisia: Sudden catastrophic mass extinction in planktic foraminifera.- Journal of Foraminiferal Research, Lawrence, vol. 30, n° 3, p. 202-218.
I., J.A. & E. (2004).- A new high-resolution planktic foraminiferal zonation and subzonation for the lower Danian.- Lethaia, Oslo, vol. 37, p. 79-95.
I., J.A. & C. (2007).- Morfología, biometría y taxonomía de foraminíferos planctónicos del Daniense basal: Palaeoglobigerina n. gen.- Revista Española de Paleontología, Madrid, vol. 22, n° 1, p. 21-62.
I., J. A. & C. (2010).- Diversidad y evolución de la textura de la pared en guembleítridos (foraminíferos planctónicos) del tránsito Cretácico-Paleógeno.- Revista Española de Paleontología, Madrid, vol. 25, n° 2, p. 89-105.
E. & S.M. (1999).- Evolution of late Campanian-Maastrichtian marine climates and oceans. In: E. & C.C. (eds.), Evolution of the Cretaceous ocean-climate system.- Geological Society of America, Special Paper, Boulder, vol. 332, p. 245-282.
E.J., M.A. & E.G. (1985).- Cretaceous rhythmic bedding sequences: a plausible link between orbital variations and climate.- Earth and Planetary Science Letters, La Jolla, vol. 72, p. 327-340.
A., P.F. & F. (1990).- Petroleum geology of Tunisia.- Entreprise Tunisienne d'Activités Pétrolières, Tunis, 194 p.
A.L. (1976).- Obliquity and precession for the last 5 000 000 years.- Astromony and Astrophysics, Paris, vol. 51, p. 127-135.
A.L. (1978a).- Long-term variations of caloric insolation resulting from the Earth's orbital elements.- Quaternary Research, Amsterdam, vol. 9, p. 139-167.
A.L. (1978b).- Long-term variations of daily insolations and Quaternary climatic changes.- Journal of the Atmospheric Sciences, Boston, vol. 35, n° 12, p. 2362-2367.
A.L. (1989).- The spectral characteristics of pre-Quaternary climatic records, an example of the relationship between the astronomical theory and geosciences. In: A., S. & J.C. (eds.), Climate and geo-sciences.- Kluwer Academic Publishers, Dordrecht, Holland, p. 47-76.
A. & M.F. (1991).- Insolation values for the climate of the last 10 million years.- Quaternary Science Reviews, Amsterdam, vol. 10, p. 297-317.
A. & M.F. (1994).- Astronomical forcing through geological time. In: P.L. de & D.G. (eds.), Orbital forcing and cyclic sequences.- Special Publications of the International Association of Sedimentologists, Oxford, vol. 19, p. 15-24.
A., M.F. & V. (1989a).- Influence of the changing lunar orbit on the astronomical frequencies of Pre-Quaternary insolation patterns.- Paleoceanography, Washington, vol. 4, n° 5, p. 555-564.
A., M.F. & V. (1989b).- Pre-Quaternary frequencies.- Nature, London, vol. 342, n° 6246, p. 133.
A., M.F. & J. (1992).- Stability of the astronomical frequencies over the Earth's history for paleoclimate studies.- Science, Washington, vol. 255, p. 560-566.
W.A., D.V., C.C. & M.-P. (1995).- A revised Cenozoic geochronology and chronostratigraphy.- In: W.A., D.V., M.-P. & J. (eds.), Geochronology, time scales and global stratigraphic correlation.- Society of Economic Paleontologists and Mineralogists, Special Publication, Tulsa, vol. 54, p. 129-212.
P.L. de & D.G. (eds.) (1994).- Orbital forcing and cyclic sequences.- Special Publications of the International Association of Sedimentologists 19, Blackwell Scientific Publications, Oxford, 559 p.
A., R.D., O., B., S., J.S., J., P. & T. (2008).- Isotopic evidence for glaciation during the Cretaceous supergreenhouse.- Science, Washington, vol. 319, n° 5860, p. 189-192.
P.R., J.A. & L.T. (1991).- Critical events in the evolutionary history of calcareous nannoplankton.- Historical Biology, London, vol. 5, p. 279-290.
H., J.P., J., G.J.M. & H. (1998).- Dinoflagellate-based sea surface temperature reconstructions across the Cretaceous-Tertiary boundary.- Palæogeography, Palæoclimatology, Palæoecology, Amsterdam, vol. 14, p. 67-83.
P.F. (1956).- Contribution à l'étude stratigraphique de la Tunisie centrale.- Annales des Mines et de la Géologie, Tunis, vol. 18, 350 p.
G., Y., J., R., J., A., L.E. & B. (1993).- Late Maastrichtian (69.5-65 Ma). In: J., L.E. & B. (eds.), Atlas Tethys palaeoenvironmental maps. Explanatory notes.- Gauthier-Villars, Paris, p. 179-196.
S.J. (2003).- Alpine glaciation in the Laramide Mountains during the Late Cretaceous and early Paleocene.- Geological Society of America Abstracts with Programs, Boulder, vol. 35, n° 6, p. 291.
S.C. (1999).- An astronomical tuning strategy for Pliocene sections: implications for global-scale correlation and phase relationships.- Philosophical Transactions of the Royal Society, London, vol. A 357, p. 1949-1973.
- J., J.I., V., - X., G. & S. (2003).- Untangling the Palaeocene climatic rhythm: an astronomically calibrated Early Palaeocene magnetostratigraphy and biostratigraphy at Zumaia (Basque basin, northern Spain).- Earth and Planetary Science Letters, La Jolla, vol. 216, n° 4, p. 483-500.
C., E., E., R., N.P., I., J.A., F., M., E., R. & I. (2001).- The Cretaceous-Palaeogene (K/P) boundary in the Aïn Settara section (Kalaat Senan, Central Tunisia): lithological, micropalaeontological and geochemical evidence.- Bulletin de l'Institut royal des Sciences naturelles de Belgique, Sciences de la Terre, Bruxelles, vol. 71, p. 169-190.
G., W. & A. (eds.) (1991).- Cycles and events in stratigraphy.- Springer-Verlag, Berlin, 955 p.
E., I. & D.K. (1995).- Cretaceous calcareous plankton biostratigraphy of Sites 872 through 879. In: J.A., I., F. & M.K. (eds.).- Proceedings of the Ocean Drilling Program, Scientific Results, College Station, vol. 144, p. 157-169.
N., X., O., L.G. & P.Y. (2006).- Lower Cretaceous stage durations combining radiometric data and orbital chronology: Towards a more stable relative time scale?- Earth and Planetary Science Letters, La Jolla, vol. 246, p. 407-417.
S. & R. (2002).- Changes in coiling direction of Cibicidoides pseudoacutus () across the Cretaceous-Tertiary boundary of Tunisia: palaeoecological and biostratigraphic implications.- Palæogeography, Palæoclimatology, Palæoecology, Amsterdam, vol. 178, n° 3-4, p. 197-210.
S., M., R, A. & R. (2003).- Orbitally modulated black shale deposition in the upper Albian Amadeus Segment (central Italy): a multi-proxy reconstruction.- Palæogeography, Palæoclimatology, Palæoecology, Amsterdam, vol. 190, p. 441-458.
S., H. & M. (2004).- Records of post-Cretaceous-Tertiary boundary millennial-scale cooling from the western Tethys: A smoking gun for the impact-winter hypothesis.- Geology, Boulder, vol. 32, p. 529-532.
S., L., E., G., C., H., S., J., J., R.P. & M. (2005).- Orbitally paced cycles from the lowermost Danian Elles section (Tunisia): implications for high-resolution chronostratigraphy across the Cretaceous/Tertiary boundary. In: EGU General Assembly, Vienna, April 24-29, 2005.- Geophysical Research Abstracts, Katlenburg-Lindau, vol. 7, 06425.
S. (2002).- Late Maastrichtian to early Danian calcareous nannofossils at Elles (Northwest Tunisia). A tale of one million years across the K-T boundary.- Palæogeography, Palæoclimatology, Palæoecology, Amsterdam, vol. 178, p. 211-231.
G.K. (1895).- Sedimentary measurement of geologic time.- Journal of Geology, Chicago, vol. 3, p. 121-127.
L. (1963).- Les régressions marines et le problème du renouvellement des faunes au cours des temps géologiques.- Bulletin de la Société géologique de France, Paris, vol. 6, n° 1, p. 13-22.
S. (2010).- Late Cretaceous ammonites from Tunisia: Chronology and causes of their extinction and extrapolation to other areas.- Aardkundige Mededelingen, Leuven, vol. 21, 220 p.; and Ph.D. thesis, Katholieke Universiteit Leuven, Department of Earth and Environmental Sciences, Vol. II, Systematics, collection plates, 316 p.
S., W.J., C. & E. (2004).- Terminal Maastrichtian ammonites from the Cretaceous-Paleogene Global Stratotype Section and Point, El Kef, Tunisia.- Cretaceous Research, London, vol. 25, p. 313-328.
A. (1987).- End-Cretaceous mass extinction event: argument for terrestrial causation.- Science, Washington, vol. 238, p. 1237-1242.
A. (1992).- Phanerozoic sea-level changes.- Columbia University Press, New York, 266 p.
A. & P.B. (1999).- Mass extinctions and sea-level changes.- Earth-Science Reviews, Amsterdam, vol. 48, p. 217-250.
B.U., J. & P.R. (1987).- Mesozoic and Cenozoic chronostratigraphy and cycles of sea-level change. In: C.K., B.S., C.G.St.C., H.W., C.A. & J.C. (eds.), Sea-level changes: an integrated approach.- Society of Economic Paleontologists and Mineralogists, Special Publication, Tulsa, vol. 42, p. 71-108.
W.W. (2008).- Evolving ideas about the Cretaceous climate and ocean circulation.- Cretaceous Research, London, vol. 29, n° 5-6, p. 725-753.
W.W., R., C.N., K.M., S., M., - A., W.-C., A.B., A.N. & E. (1999).- Alternative global Cretaceous paleogeography. In: E. & C. (eds.), Evolution of Cretaceous ocean-climate system.- Geological Society of America, Special Paper, Boulder, vol. 332, p. 1-47.
M. & C. (2003).- Proposition d'une échelle chronométrique autour de la limite Crétacé-Paléogène par cyclostratigraphie : coupe de l'Aïn Settara (Kalaat Senan, Tunisie centrale).- Geobios, Lyon, vol. 36, p. 707-718.
M., F. & S. (2009).- Cyclostratigraphy and chronometric scale in the Campanian - Lower Maastrichtian: the Abiod Formation at Ellès, central Tunisia.- Cretaceous Research, London, vol. 30, p. 325-338.
A.S. (1993).- Biochronology of the terminal Cretaceous calcareous nannofossil zone of Micula prinsii.- Cretaceous Research, London, vol. 14, p. 59-68.
T.D. (1999).- Toward a composite orbital chronology for the Late Cretaceous and Early Palaeocene GPTS.- Philosophical Transactions of the Royal Society, London, vol. A 357, p. 1735-1759.
T.D. & S.L. (1990).- Precessional climate cyclicity in Late Cretaceous-Early Tertiary marine sediments: a high resolution chronometer of Cretaceous-Tertiary boundary events.- Earth and Planetary Science Letters, La Jolla, vol. 99, p. 263-275.
T.D., J. & S. (1999).- Precessional cycles in Upper Cretaceous pelagic sediments of the South Atlantic: Long-term patterns from high-frequency climate variations. In: E. & C.C. (eds.), Evolution of the Cretaceous ocean-climate system.- Geological Society of America, Special Paper, Boulder, vol. 332, p. 105-120.
A.R. & W.V. (1990).- Proximal Cretaceous-Tertiary boundary impact deposits in the Caribbean.- Science, Washington, vol. 248, p. 843-847.
A.R., G.T., D.A., M., Z.A., S.B. & W.V. (1991).- The Chicxulub Crater: A possible Cretaceous-Tertiary boundary impact crater on the Yucatán Peninsula, Mexico.- Geology, Boulder, vol. 19, n° 9, p. 867-871.
F.J., L.J., A. & M.F. (1993).- Evaluation of the astronomically calibrated time scale for the latest Pliocene and earliest Pleistocene.- Paleoceanography, Washington, vol. 8, n° 5, p. 549-565.
F.J., H., W., C.G., L.J., J.E., I., J., E., N., J.R. & W.J. (1999).- Present status of the astronomical (polarity) time-scale for the Mediterranean Late Neogene.- Philosophical Transactions of the Royal Society, London, vol. A 357, p. 1931-1947.
F.J., W., K.F., L.J. & J.R. (2006).- Astronomical calibration of the geological time and intercalibration with 40Ar/39Ar and U/Pb dating.- 2006 Philadelphia Annual Meeting (22-25 October 2006), Paper n° 18-7, Geological Society of America Abstracts with Programs, Boulder, vol. 38, n° 7, p. 52.
L.A. (2000).- New perspectives on orbitally forced stratigraphy.- Annual Reviews of Earth and Planetary Science, Palo Alto, vol. 28, p. 419-475.
L.A. (2004).- Earth's orbital parameters and cycle stratigraphy. In: F., J. & A. (eds.), A geologic time scale 2004.- Cambridge University Press, Cambridge, p. 55-62.
L.A. & J.G. (2007).- Cyclostratigraphy and the astronomical time scale.- Stratigraphy, New York, vol. 4, n° 2-3, p. 239-251.
L.A. & J. (1998).- Detection of astronomical cycles in the stratigraphic record by frequency modulation (FM) analysis.- Journal of Sedimentary Research, Tulsa, vol. 68, n° 4, p. 524-539.
M.R. & A.S. (eds.) (1995).- Orbital forcing timescales and cyclostratigraphy.- Geological Society, Special Publication, London, n° 85, 210 p.
D., B., J., L.A., N., S. & R.E. (2011).- Astronomical calibration of the Maastrichtian (Late Cretaceous).- Earth and Planetary Science Letters, La Jolla, vol. 305, n° 3-4, p. 328-340.
G. & A. (2004).- Disaster opportunists Guembelitrinidae: index for environmental catastrophes.- Marine Micropaleontology, Amsterdam, vol. 53, p. 83-116.
G. & W. (1996).- Sea-level changes, clastic deposits and megatsunamis across the Cretaceous-Tertiary boundary. In: N. & G. (eds.), Cretaceous-Tertiary mass extinctions: biotic and environmental changes.- W.W. Norton & Company, New York, London, p. 415-449.
G., T., W., V., N. & D. (2002).- Paleoecology of the Cretaceous-Tertiary mass extinction in planktonic foraminifera.- Palæogeography, Palæoclimatology, Palæoecology, Amsterdam, vol. 178, n° 3-4, p. 257-297.
D.V. (1977).- An estimate of the duration of the faunal change at the Cretaceous-Tertiary boundary.- Geology, Boulder, vol. 5, n° 12, p. 769-771.
D.V., P.E. & W.K. (1995).- Late Triassic-Earliest Jurassic geomagnetic polarity reference sequence from cyclic continental sediments of the Newark rift basin (eastern North America).- Albertiana, Utrecht, vol. 16, p. 17-26.
K.F., A., F.J., W., P.R. & J.R. (2008).- Synchronizing rock clocks of Earth history.- Science, Washington, vol. 320, n° 5875, p. 500-504.
J. (1988).- Secular evolution of the solar system over 10 millions years.- Astronomy and Astrophysics, Paris, vol. 198, p. 341-362.
J. (1989).- A numerical experiment on the chaotic behaviour of the Solar System.- Nature, London, vol. 338, p. 237-238.
J. (1990).- The chaotic motion of the Solar System: A numerical estimate of the size of the chaotic zones.- Icarus, Ithaca, vol. 88, p. 266-291.
J. (1999).- The limits of Earth orbital calculations for geological time-scale use.- Philosophical Transactions of the Royal Society, London, vol. A 357, p. 1735-1759.
J., F. & F. (1993).- Orbital, precessional, and insolation quantities for the Earth from -20 Myr to +10 Myr.- Astronomy and Astrophysics, Paris, vol. 270, p. 522-533.
J., P., F., M., A.C.M. & B. (2004).- A long term numerical solution for the insolation quantities of Earth.- Astronomy and Astrophysics, Paris, vol. 428, n° 1, p. 261-285.
J., A., M. & H. (2011).- La2010: A new orbital solution for the long term motion of the Earth.- Astronomy & Astrophysics, Paris, vol. 532, paper A89, 15 p.
L., G., T. & W. (2000).- Late Cretaceous sea-level changes in Tunisia: a multi-disciplinary approach.- Journal of the Geological Society, London, vol. 157, p. 447-458.
L.J., F.J., J., N.J. & D. (2004).- The Neogene Period. In: F.M., J.G. & A.G. (eds.), A geologic time scale 2004.- Cambridge University Press, p. 409-440.
L.J., A., D., J. C., E., U., J. & I. (2005).- Astronomical pacing of late Paleocene to early Eocene global events.- Nature, London, vol. 435, p. 1083-1087.
V. (2002).- High-resolution planktonic foraminiferal analysis from the Cretaceous-Tertiary boundary at Aïn Settara (Tunisia): evidence of an extended mass extinction.- Palæogeography, Palæoclimatology, Palæoecology, Amsterdam, vol. 178, p. 299-319.
H.P. & I. (1964).- Biostratigrafia del limite Cretaceo-Terziario nell'Appennino centrale.- Rivista Italiana di Paleontologia e Stratigrafia, Milano, vol. 70, p. 67-128.
C.R. & P.D. (1996).- Sudden and gradual molluscan extinctions in the latest Cretaceous of Western European Tethys.- Science, Washington, vol. 274, n° 5291, p. 1360-1363.
D.M. (1981).- Terminal Cretaceous Extinctions and Volcanism: a Link.- Abstracts of Papers of the 147th National Meeting, 3-8 January 1981, Toronto, Ontario, Canada, American Association for the Advancement of Science, p. 128.
D.M. (1985).- Deccan traps mantle degassing in the terminal Cretaceous marine extinctions.- Cretaceous Research, London, vol. 6, p. 235-259.
M. (1941).- Kanon der Erdbestrahlung und seine Anwendung auf das Eiszeitenproblem.- Royal Serbian Sciences, Special publication, Belgrade, vol. 132, section of Mathematical Sciences 33, 633 p.
K.G., E., R.K., P.J. & S.M. (1999).- Does ice drive early Maastrichtian eustasy?- Geology, Boulder, vol. 27, p. 783-786.
K.G., J.D. & J.V. (2005).- Visions of ice sheets in a greenhouse world.- Marine Geology, Amsterdam, vol. 217, p. 215-231.
E., I. & J.A. (1998).- Mass extinction in planktic foraminifera at the Cretaceous/Tertiary boundary in subtropical and temperate latitudes.- Bulletin de la Société géologique de France, Paris, vol. 169, p. 351-363.
E., L., I., J.A., N., J., K., E., N. & - D. (2006).- The Global Boundary Section and Point for the base of the Danian Stage (Paleocene, Paleogene, "Tertiary", Cenozoic) at El Kef, Tunisia - Original definition and revision.- Episodes, Beijing, vol. 29, n° 4, p. 263-273.
R.D., D., A. et al. (Shipboard Scientific Party) (1998).- Site 1049. Explanatory notes.- Proceedings of the Ocean Drilling Program, Initial Reports, College Station, vol. 171B, p. 11-44.
J.G., F.P. & F.M. (2004).- The Cretaceous Period. In: F., J. & A. (eds.), A geologic time scale 2004.- Cambridge University Press, Cambridge, p. 344-383.
P.E. & D. V. (1996).- climate forcing in the tropics of Pangea during the Late Triassic.- Palæogeography, Palæoclimatology, Palæoecology, Amsterdam, vol. 122, p. 1-26.
P.E. & D. V. (1999).- Long-period cycles from the Late Triassic and Early Jurassic of eastern North America and their implications for the calibration of the early Mesozoic time scale and the long-term behavior of the planets.- Philosophical Transactions of the Royal Society, London, vol. A 357, p. 1761-1787.
H., N.J. & U. (2001).- Astronomical forcing in Late Eocene marine sediments.- Earth and Planetary Science Letters, La Jolla, vol. 193, p. 589-602.
H., R.D., J.O., P.A., H.K., C.H., N.J., A.K., B.S. et al. (2006).- The heartbeat of the Oligocene Climate System.- Science, Washington, vol. 314, p. 1894-1898.
A., N. & G. (1996).- Latest Maastrichtian and Cretaceous-Tertiary boundary foraminiferal turnover and environmental changes at Agost, Spain. In: N. & G. (eds.), Cretaceous-Tertiary boundary mass extinction: Biotic and environmental changes.- W.W. Norton & Company, New York, London, p. 139-172.
K., J. & Q. (1982).- Biostratigraphy and isotope stratigraphy and the "catastrophic" extinction of calcareous nannoplankton at the Cretaceous/Tertiary boundary. In: L.T. & P.H. (eds.), Geological implications of impacts of large asteroids and comets on the Earth.- Geological Society of America, Special Paper, Boulder, vol. 190, p. 353-371.
D., L. & E. (2002).- The Cretaceous/Palaeogene (K/P) boundary at Aïn Settara, Tunisia: reconstructing of benthic foraminiferal assemblages.- Terra Nova, Oxford, vol. 14, p. 101-107.
A.G. & D. (2000).- The falling stage systems tract: recognition and importance in sequence stratigraphic analysis. In: D. & R.L. (eds.), Sedimentary responses to forced regressions.- Geological Society, Special Publication, London, vol. 172, p. 1-17.
H.W. & W.R. (2000).- Aspect of the stratal architecture of forced regressive deposits. In: D. & R.L. (eds.), Sedimentary responses to forced regressions.- Geological Society, Special Publication, London, vol. 172, p. 19-46.
H.W., G.P., D.P. & M. (1992).- Forced regressions in a sequence stratigraphic framework: concepts, examples, and exploration significance.- American Association of Petroleum Geology Bulletin, Tulsa, vol. 76, p. 1687-1709.
W.L. & J.E. (1987).- Variability of the monsoon over the past 150,000 years: comparison of observed and simulated paleoclimatic time series.- Journal of Geophysical Research, Washington, vol. 92, p. 8411-8425.
J.A. (1999).- Pacemaking the ice ages by frequency modulation of Earth's orbital eccentricity.- Science, Washington, vol. 285, p. 564-568.
F., J.M., D., F., M., C., A.V. & S. (2000).- Le Crétacé supérieur de la région de Kalaat Senan, Tunisie Centrale. Litho-biostratigraphie intégrée : zones d'ammonites, de foraminifères planctoniques et de nannofossiles du Turonien supérieur au Maastrichtien.- Bulletin des Centres de Recherche et Exploration-Production elf-aquitaine, Pau, vol. 22, n° 2, p. 359-490.
E., R., D., C. & - D. (2001).- Local variations in spinel compositions at the K/T boundary in Tunisia: Evidence for long range dispersion of impact debris.- European Science Foundation meeting, Granada, Spain (abstract), p. 107.
N.J., I.N. & G.P. (1999).- Astronomical () calibration of the geological time-scale.- Philosophical Transaction of the Royal Society, London, vol. A 357, p. 1731-2007.
J. (1982).- Extinction and evolution of planktonic foraminifera after a major impact at the Cretaceous/Tertiary boundary. In: L.T. & P.H. (eds.), Geological Implications of Impacts of Large Asteroids and Comets on the Earth.- Geological Society of America, Special Paper, Boulder, vol. 190, p. 329-352.
J. & J. (1980).- An extraterrestrial event at the Cretaceous-Tertiary boundary.- Nature, London, vol. 285, p. 198-200.
A.G., D.G. & B.M. (1994).- Atlas of Mesozoic and Cenozoic coastlines.- Cambridge University Press, Cambridge, 99 p.
M., R., F., N. & F. (2006).- Orbital tuning of a Lower Cretaceous composite record (Maiolica Formation - Central Italy).- Paleoceanography, Washington, vol. 21, PA4212, doi: 10.1029/2005PA001224.
G.M., G.D., W., J. & P.A. (2001).- The paleotectonic atlas of the peri-Tethyan domain.- European Geophysical Society, CD-ROM, ISBN 3-9804862-6-5.
W. & G. (1996).- K/T boundary coarse-grained siliciclastic deposits in northeastern Mexico and northeastern Brazil: Evidence for mega-tsunami or sea-level changes? In: G., D. & S. (eds.), The Cretaceous-Tertiary event and other catastrophes in Earth history.- Geological Society of America, Special Paper, Boulder, vol. 307, p. 197-209.
F. (1997).- A cool-water carbonate ramp with bryozoan mounds: late Cretaceous-Danian of the Danish Basin.- Society of Economic Paleontologists and Mineralogists, Special Publication, Tulsa, vol. 56, p. 296-307.
N., C. & E. (2000).- Sedimentological and diagenetical conditions of the impact level of the Cretaceous/Tertiary boundary in Tunisia: no anoxia required.- Bulletin de la Société géologique de France, Paris, vol. 171, p. 629-636.
F., B. & M. (2003).- Successive refinements in long-term integrations of planetary orbits.- The Astrophysical Journal, Washington, vol. 592, p. 620-630.
J. (2010).- The aftermath of the Cretaceous-Paleogene bolide impact: Unraveling earliest Danian environmental change.- MSc. thesis, Faculty of Geosciences, Utrecht University, 51 p.
P.R. (1972).- Evidence for global synchronism in mantle plume convection, and possible significance for geology.- Nature, London, vol. 240, p. 338-342.
P. D. (1990).- A review of Maastrichtian ammonite ranges. In: V.L. & P.D. (eds.), Global catastrophes in Earth history: an interdisciplinary conference on impacts, volcanism, and mass mortality.- Geological Society of America, Special Paper, Boulder, vol. 247, p. 519-530.
T., U., J., I., J., L.J. & J.C. (2007).- On the duration of magnetochrons C24r and C25n and the timing of early Eocene global warming events: Implications from the Ocean Drilling Program Leg 208 Walvis Ridge depth transect.- Paleoceanography, Washington, vol. 22, n° 2, PA2201, doi: 10.1029/2006PA001322.
T., U., I., E., S., V., J. & H.F. (2008).- Astronomical calibration of the Paleocene time.- Palæogeography, Palæoclimatology, Palæoecology, Amsterdam, vol. 257, p. 377-403.
The Aïn Settara section has been surveyed and sampled as two sub-sections
separated by about 20 m and named SETA and SETB. The SETA sub-section begins close to the bottom of the Settara Wadi and goes up to the K-Pg boundary (Maastrichtian). The SETB sub-section begins at the K-Pg boundary and terminates at about 16.50 m (Danian). Samples are labeled following the elevation in metres. Both the sub-sections are clearly seen on Figures
4 ![]() , 5
, 5 ![]() and 9
and 9 ![]() .
.
On Appendix-Figure 1 A ![]() and B
and B ![]() , the "visual CaCO3 content" is a field evaluation obtained by combining rock colour (variations of gray) and hardness (relief or hollow, resistance to the hammer). The "analytic CaCO3 content" is the results from 253 calcimetric measurements (an average of more than 4 per metre). As sampling spacing was not sufficient to elaborate a carbonate curve that can be satisfactorily interpreted in terms of cyclostratigraphy, the (continuous) visual curve was fitted to the (discontinuous) calcimetric values. Cyclostratigraphic interpretation is explained in the main text of the paper.
, the "visual CaCO3 content" is a field evaluation obtained by combining rock colour (variations of gray) and hardness (relief or hollow, resistance to the hammer). The "analytic CaCO3 content" is the results from 253 calcimetric measurements (an average of more than 4 per metre). As sampling spacing was not sufficient to elaborate a carbonate curve that can be satisfactorily interpreted in terms of cyclostratigraphy, the (continuous) visual curve was fitted to the (discontinuous) calcimetric values. Cyclostratigraphic interpretation is explained in the main text of the paper.
A. 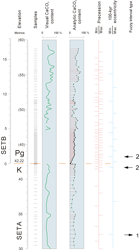 B.
B. 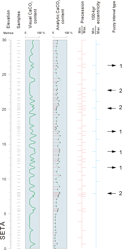
Click on thumbnail to enlarge the image.
Appendix-Figure 1: A. Details of the sub-section SETB and the upper part of sub-section SETA. B. Details of the lower part of sub-section SETA.