◄ Carnets Geol. 17 (4) ►
![]()
Contents
[1. Introduction]
[2. Rough sketch of the Pinda stratigraphy]
[3. Seismic and wireline log markers]
[4. The facies]
[5. Correlations]
[6. conclusion]
[Bibliographic references] and ... [Plates]
"Cátedra
Franco-Brasileira no Estado de Săo Paulo 2015", UNESP - Universidade
Estadual Paulista, Center for Geosciences Applied to Petroleum (UNESPetro),
Caixa Postal 178, Av. 24 A, no. 1515, Bela Vista, CEP13506-900 - Rio Claro - SP
(Brazil);
Dépt. STU, Fac. Sci. Tech., UBO, 6 avenue Le Gorgeu, CS 93837, F-29238 Brest (France)
Department of Ecology and Evolutionary Biology,
The University of Kansas, 1200 Sunnyside Avenue, Lawrence, Kansas 66045 (USA)
Published online in final form (pdf) on June 25,
2017
DOI 10.4267/2042/62283
[Editor: Michel Moullade; language editor:
Phil Salvador; technical editor: Bruno Granier]
![]()
The Pinda Group of the Congo basin in the northern Angolan offshore is an overall transgressive supersequence of late Aptian - ? early Cenomanian age. Due to synsedimentary salt tectonics of the underlying Loeme Salt, the original ramp arrangement is split into discrete structures corresponding to many proven, probable and possible oil and gas plays. Where the biostratigraphic information was not destroyed by pervasive dolomitization, the little that remains is not available to the general public because it is treated as proprietary data by the Sociedade Nacional de Combustíveis de Angola Empresa Pública – Sonangol E.P. Only a limited set of data containing lithostratigraphic information (e.g., some published well logs and photomicrographs of facies) is available. The aim of this paper is to give a little more information about the Pinda stratigraphy. For instance, to be formally defined, this poorly known unit required a type section, a shortcoming that is addressed here. The wireline log signatures of some regional seismic markers are documented because they are used to correlate wells and subdivide the Group into formations. The microfacies corresponding to some key electrofacies as well as the porosity types are also condensed in a microphotograph catalog. Finally, few examples of typical LoC (i.e., Line of Correlation) diagrams are displayed and interpreted.
• Angola;
•
Pinda;
• Albian;
• Cenomanian;
• reservoirs;
• dolomite;
• stratigraphy.
Granier B. (2017).- New stratigraphic and genetic model for the dolomitic Cretaceous Pinda reservoirs in Angola. Part I - The Pinda of Angola, an integrated lithostratigraphic approach.- Carnets Geol., Madrid, vol. 17, no. 4, p. 105-127.
Nouveau modčle stratigraphique et génétique pour les réservoirs dolomitiques du Pinda (Crétacé) en Angola. 1re partie - Le Pinda d'Angola, une approche lithostratigraphique intégrée.- Dans le bassin du Congo, domaine maritime septentrional de l'Angola, le Groupe Pinda représente une mégaséquence globalement transgressive d'âge Aptien supérieur ŕ Cénomanien ? inférieur. En raison d'une tectonique salifčre synsédimentaire liée au Loeme Salt sous-jacent, l'agencement d'origine en rampe est disloqué en structures individualisées correspondant ŕ autant d'objectifs pétroliers et gaziers avérés, probables et possibles. Lorsque l'information biostratigraphique n'a pas été détruite par une dolomitisation quasi générale, le peu de données existantes n'est pas accessible au public car considéré comme propriété exclusive par la Sociedade Nacional de Combustíveis de Angola Empresa Pública – Sonangol E.P. Seul un ensemble relativement limité de données lithostratigraphiques (quelques publications de diagraphies de puits ou des photos de microfacičs, par exemple) est diponible. L'objectif de cet article est de donner un peu plus d'informations sur la stratigraphie du Pinda. Ainsi, pour ętre formellement définie, cette unité trop mal connue a besoin d'une section de référence, une lacune qui est corrigée ici. Les signatures diagraphiques de quelques marqueurs sismiques régionaux sont consignées parce qu'elles sont utilisées pour corréler les puits et subdiviser le Groupe en formations. Les microfacičs correspondant aux quelques électrofacičs les plus communs ainsi que divers types de porosités sont également rassemblés dans un catalogue photographique. Enfin, quelques exemples de diagrammes de corrélations graphiques présentant des puits sous forme de "Lignes de Corrélations" sont discutés et interprétés.
• Angola ;
• Pinda ;
• Albien ;
• Cénomanien ;
• réservoirs ;
• dolomie ;
• stratigraphie.
Novo modelo estratigráfico e genético para os reservatórios dolomíticos cretácicos Pinda, em Angola Parte I - O Pinda de Angola, um enfoque litoestratigráfico integrado.- O Grupo Pinda, Bacia do Congo, no mar afora do norte de Angola, é no geral uma supersequęncia transgressiva de idade neoaptiana - (?) eocenomaniana. Devido ŕ tectônica salífera sinsedimentar associada ao subjacente Sal Loeme, a rampa é dividida em distintas estruturas que correspondem a muitos plays de óleo e gás comprovados, prováveis e possíveis. Onde a informaçăo bioestratigráfica năo foi destruída por dolomitizaçăo pervasiva, o pouco que resta năo está disponível para o público em geral; é tratado como dados proprietários pela Sociedade Nacional de Combustíveis de Angola Empresa Pública – Sonangol E.P. Somente um conjunto limitado de dados contendo informaçăo litoestratigráfica está disponível (e.g., alguns perfis de poços publicados e fotomicrografias de fácies). O objetivo deste artigo é oferecer um pouco mais de informaçăo sobre a estratigrafia do Grupo Pinda. Por exemplo, para ser formalmente definida, esta unidade pobremente conhecida deveria ter uma seçăo tipo, uma lacuna que é aqui apontada. As assinaturas em perfis de poços de alguns marcadores sísmicos regionais săo documentados, uma vez que eles tęm sido usados para correlacionar poços para subdividir o grupo em formaçőes. As microfácies correspondentes a algumas eletrofácies-chave, assim como os tipos de porosidade, săo também reunidas em um catálogo fotomicrográfico. Finalmente, alguns exemplos de típicos diagramas LoC (i.e., Linha de Correlaçăo) săo apresentados e interpretados.
• Angola;
• Pinda;
• Albiano;
• Cenomaniano;
• reservatórios;
• dolomito;
• estratigrafia.
In
the Congo basin of northern Angola, following the early Aptian syn-rift episode
characterized by the Loeme Salt deposition, the first post-rift episode spanning
the late Aptian - ? early Cenomanian interval corresponds to the overall
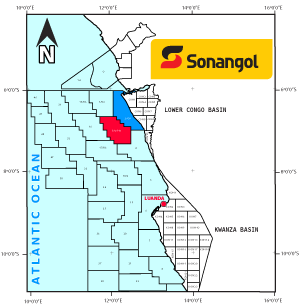
transgressive supersequence refered to as the Pinda Group (Fig. 1 ![]() ).
The latter
consists from base to top of immature siliciclastic sediments passing gradually
to shallow-water limestones (commonly extensively dolomitized), that in turn
pass into hemipelagic marl-limestone rhythmites and deeper-water marls. Another
post-rift episode, which overlies the Pinda, corresponds to the dominantly shaly
Iabe Group. This last group, ranging in age from the Cenomanian to the Eocene,
was affected by multiple intraformational unconformities. The lower part of the
Pinda, which has locally proved to host oil and gas reservoirs, has been
extensively explored and a significant number of wells were drilled, with some
cores recovered. The integrated lithostratigraphic approach documented below is
intended to provide support and guidance to junior geologists working on the
Pinda or similar formations, i.e.,
a sort of "starter kit".
).
The latter
consists from base to top of immature siliciclastic sediments passing gradually
to shallow-water limestones (commonly extensively dolomitized), that in turn
pass into hemipelagic marl-limestone rhythmites and deeper-water marls. Another
post-rift episode, which overlies the Pinda, corresponds to the dominantly shaly
Iabe Group. This last group, ranging in age from the Cenomanian to the Eocene,
was affected by multiple intraformational unconformities. The lower part of the
Pinda, which has locally proved to host oil and gas reservoirs, has been
extensively explored and a significant number of wells were drilled, with some
cores recovered. The integrated lithostratigraphic approach documented below is
intended to provide support and guidance to junior geologists working on the
Pinda or similar formations, i.e.,
a sort of "starter kit".
|
Figure 1:
Location of Blocks 2 (blue) and 3 (red) in Angola's concessions (excerpt
from GAD201501-DMC0001-I-A). |
As
a practical stratigrapher I have always developed holostratigraphic approaches, i.e., holistic approaches of stratigraphy, to address most
questions and more specifically reservoir and seal issues that are relevant for
the oil and gas industry. The Greek prefix hólos
indicates that ideally all approaches and techniques of stratigraphy should be
involved to result in a balanced and integrated synthesis. However, in the case
studied, there are several limitations. For instance, no biostratigraphic data
has been presented for Angolan fields. Pervasive dolomitization is responsible
for the destruction of most calcareous microfossils in the Pinda interval.
However, comparison with time-equivalent and less diagenetically altered units
in Angola (DSDP Site 364, off the Kwanza basin, see Kochhann et
al., 2013), in Congo (Sendji Formation of the Congo basin, see Masse,
1995) and in Brazil (Riachuelo Formation of the Sergipe-Alagoas basin, see Koutsoukos
et al., 1991, inter alia)
corroborates the late Aptian to ? early Cenomanian ages. It is worth mentioning
that published records of calcareous microfossils are anecdotal. For instance, Romanes
(1916) described "Lithothamnion angolense" from material collected by J.W. Gregory
near Lobito (Benguela Province). This
calcareous alga, which is a synonym of Marinella
lugeoni Pfender, 1939, has no stratigraphic value (Granier
& Dias-Brito, 2016). More recently, Ferré and Granier
(2001) documented the occurrence of the planktonic foraminifer Favusella
washitensis (Carsey), an Albian-Cenomanian species
(Pl. 1 ![]() ,
figs. 10-11), associated with exceptionally well-preserved reoveacrinids, i.e.,
planktonic stemless microcrinoids, from middle Pinda cores of the Bagre 1 well
(Block 2, offshore Angola). Alternatively, palynology, which involves the study
of organic microfossils, was used to address biostratigraphic issues.
Unfortunately, these studies are proprietary, and therefore unavailable to us.
Consequently, we shall focus solely on lithostratigraphy.
,
figs. 10-11), associated with exceptionally well-preserved reoveacrinids, i.e.,
planktonic stemless microcrinoids, from middle Pinda cores of the Bagre 1 well
(Block 2, offshore Angola). Alternatively, palynology, which involves the study
of organic microfossils, was used to address biostratigraphic issues.
Unfortunately, these studies are proprietary, and therefore unavailable to us.
Consequently, we shall focus solely on lithostratigraphy.
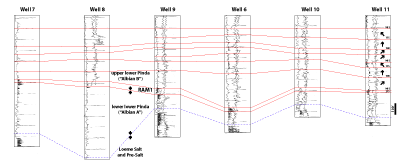
The
lower boundary of the Pinda (Figs. 2 ![]() & 4
& 4 ![]() ) with the Loeme Salt has never been observed as a
normal stratigraphic contact but most often as a gravitational gliding surface
that forms the sole of huge sedimentary rafts. In fact, the Pinda carbonate ramp
system is split into a mosaic of NNE-SSW elongated structures, a few kilometres
wide and several kilometres long, which contain many prospects or discrete oil
and gas fields, usually named after fish in Block 2 (e.g.,
Lombo for "loin" and Sulele for "sole") and after mammals in Block 3
(Palanca for "antilope" and Búfalo for "buffalo").
) with the Loeme Salt has never been observed as a
normal stratigraphic contact but most often as a gravitational gliding surface
that forms the sole of huge sedimentary rafts. In fact, the Pinda carbonate ramp
system is split into a mosaic of NNE-SSW elongated structures, a few kilometres
wide and several kilometres long, which contain many prospects or discrete oil
and gas fields, usually named after fish in Block 2 (e.g.,
Lombo for "loin" and Sulele for "sole") and after mammals in Block 3
(Palanca for "antilope" and Búfalo for "buffalo").
The
upper boundary of the Pinda (Figs. 2 ![]() - 3
- 3 ![]() )
with the Iabe Group is an unconformity, commonly
interpreted as multiple submarine erosional surfaces cutting more or less deeply
into the Pinda (locally down to the middle Pinda). Therefore the Pinda can be
treated as a lithostratigraphic unit, either an UBU, i.e.,
Unconformity-Bounded Unit or
an alloformation.
)
with the Iabe Group is an unconformity, commonly
interpreted as multiple submarine erosional surfaces cutting more or less deeply
into the Pinda (locally down to the middle Pinda). Therefore the Pinda can be
treated as a lithostratigraphic unit, either an UBU, i.e.,
Unconformity-Bounded Unit or
an alloformation.
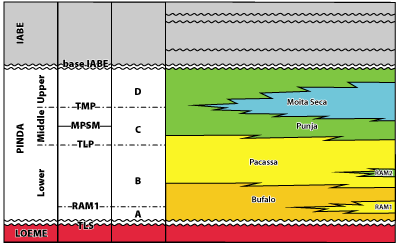
In
addition, because the Pinda is also very thick, e.g.,
reaching 860 m in thickness at Lombo East 1 well in the Block 2 in the Angolan
offshore, it may be --and at one time was-- divided into subunits. elf
--also known as SNEA(P)--, the former operating company on Block 2 in the
Angolan offshore, subdivided the Pinda into four facies-based formations derived
from Stark (1991; see Eichenseer et
al., 1999): Bufalo, Pacassa, Punja and Moita Seca units, that we
shall not refer to as "formations" but as "facies", and four time-based
formations (see Eichenseer et al., 1999): "Albian" A, B, C, and D. On the other hand, Total,
the former operating company of some fields on the neighbouring Block 3,
subdivided it into three time-based formations (Stark, 1991): lower Pinda
(equivalent to Albian A and B), middle Pinda (equivalent to Albian C) and upper
Pinda (equivalent to Albian D), each bounded by seismic markers. Thus, the
TLP-Top Lower Pinda (Figs. 3 ![]() - 4
- 4 ![]() ) and the TMP-Top Middle Pinda
(Fig. 3
) and the TMP-Top Middle Pinda
(Fig. 3 ![]() )
were primarily defined by
seismic markers before they were identified on well logs and cores. The MPSM
(Middle Pinda Seismic Marker, Fig. 3
)
were primarily defined by
seismic markers before they were identified on well logs and cores. The MPSM
(Middle Pinda Seismic Marker, Fig. 3 ![]() ) within the middle Pinda and two RAM's
(RadioActive Markers), detected on the gamma ray log within the lower Pinda,
allow further subdivision of these units, i.e.,
the lower RAM or RAM1 (Fig. 4
) within the middle Pinda and two RAM's
(RadioActive Markers), detected on the gamma ray log within the lower Pinda,
allow further subdivision of these units, i.e.,
the lower RAM or RAM1 (Fig. 4 ![]() )
marks the boundary of the Albian A and B.
)
marks the boundary of the Albian A and B.
|
Figure 2: Pinda stratigraphic nomenclature (formations, members, facies, and key
surfaces). |
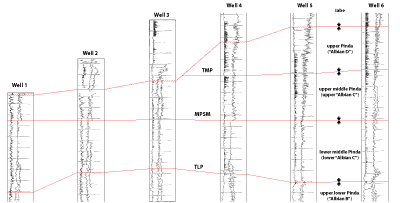
|
|
Figure 3: Wells 1 to 6, with base Iabe, TMP, MPSM and TLP markers, that
frame the upper Pinda, upper middle Pinda and lower middle Pinda. |
|
|
Figure 4:
Wells 7 to 12, with RAM 1 and Top Salt, which frame the lower
lower Pinda. |
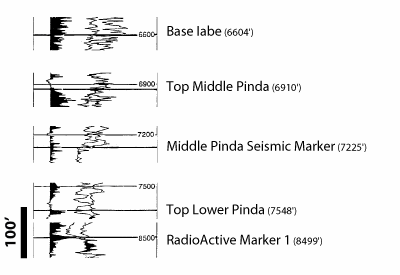
The reference section selected for the Pinda and its subunits is the Lombo East 1 well because key information from it has already been published (Stark, 1991, p. I-55; the few new depth ascriptions are hereafter indicated by asterisks):
|
Figure 5: Zooming in on the Lombo East 1 Pinda markers. |
Prior to seeing the actual rock from the subsurface, the explorationist gets a seismic image that, with some technical support from geophysicists, helps visualize potential reservoirs and their seals, as well as some seismic markers. When the well is drilled, geologists will then identify these features on a set of wireline logs (gamma ray (GR), conventional or spectral or both, neutron porosity (NPhi), bulk density (RhoB), inter alia). They will also analyze drill bit cuttings of rock to better understand the succession of lithologies. Eventually a sedimentologist will have access to a core and the macrofacies, then to a thin-section and the microfacies.
The seismic markers (TMP, MPSM, TLP) can be easily correlated over Blocks 2 and 3 of the lower Congo basin. They are also easy to pick on well logs due to the specific GR signatures above and below the marker and a porosity break at the marker. Because they are located at trend reversals, they are assumed to correspond to maximum flooding events. As a consequence of this, the Albian C (or middle Pinda), for instance, is not an unconformity-bounded unit.
Because these markers are located in non-reservoir intervals, either in Moita Seca or Punja facies, no core were recovered from these intervals. However, drill cuttings may be examined instead. The lithology is usually inferred directly from the electrofacies only.
A)
Wireline logs may be used separately. The GR values are low in the dolosparites,
in the anhydrites of the Loeme Salt or anhydrite as fracture fill, and in cherty layers; high values are found in silty-sandy
dolosparites and arkosic sandstones, which are rich in mica and feldspar, and in
organic-rich dolomicrites. The RhoB tool measures the density of rock in the
subsurface. It tends toward a 2.71
g/cm3 value for calcite (limestones), 2.64 g/cm3 for the
cherts and siliciclastic-rich layers, 2.88 g/cm3 for the dolomitic
layers, either dolomicrites or dolosparites, and 2.98 g/cm3 for
anhydrite of the Loeme Salt or across anhydrite filled open fractures (Pl. 4 ![]() ,
figs. 4-5). The presence of porosity will decrease these values read by the
tool.
,
figs. 4-5). The presence of porosity will decrease these values read by the
tool.
According to Phil Salvador (personal communication, June 14, 2017), "the NPhi curve represents a conversion of the raw neutron data from the neutron tool, converted to read as a porosity curve. It is calibrated to read "correct" porosity in an assumed lithology and assumed pore-filling fluid. These are commonly limestone and sea water, respectively. Formations of different lithology, and pore fluids (e.g., oil or gas) will yield incorrect apparent porosity, and corrections must be made". NPhi values vary significantly from very high in vuggy dolosparites, to high in regular dolosparites and sandstones, to low in dolomicrosparites, and they are equal to zero in some tight limestones, or even negative (depending upon tool model), in anhydritic intervals.
B) Wireline logs may also be used in combination. Local experience indicates that a low GR value combined with a RhoB value tending toward 2.64 g/cm3 point to cherts. When the RhoB value tends toward 2.88 g/cm3 or 2.98 g/cm3 the pair of logs points to dolosparites or anhydrite, respectively. The NPhi values will then help to discriminate the porous dolosparites from the tight anhydrite. A high GR value combined with a RhoB value tending toward 2.64 g/cm3 points to arkosic "radioactive" sandstones and sandy dolosparites. A high GR value combined with a RhoB value tending toward 2.88 g/cm3 points to organic-rich dolomicrites.
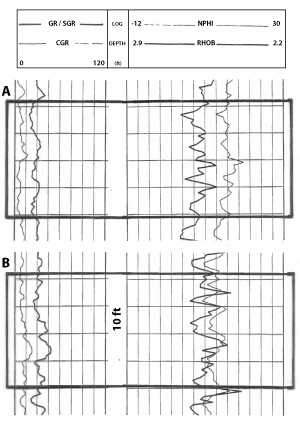
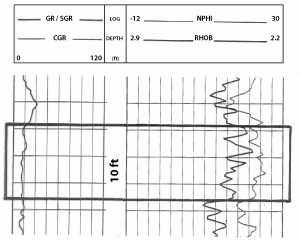
In
practice, however, there are a number of side problems related to the complex
mineralogical nature of the reservoir rock, its porous network and the fluids
inside the porosity. For instance, local occurrence of gas at the top of some
oil reservoirs may significantly shift the RhoB curve towards lighter values
(see Fig. 6 ![]() , for instance); gas will also slightly shift the NPhi curve towards
a low porosity reading. According to R.E. Ballay (personal communication,
March 1, 2017) "In most cases the gas effect on the NPhi will be larger than
the gas effect on the RhoB. This is because the NPhi reads deeper into the
formation than does the RhoB, and so mud filtrate flushing - which diminishes
the gas presence, and thus diminishes the gas effect - will often be greater on
the NPhi than on the RhoB".
, for instance); gas will also slightly shift the NPhi curve towards
a low porosity reading. According to R.E. Ballay (personal communication,
March 1, 2017) "In most cases the gas effect on the NPhi will be larger than
the gas effect on the RhoB. This is because the NPhi reads deeper into the
formation than does the RhoB, and so mud filtrate flushing - which diminishes
the gas presence, and thus diminishes the gas effect - will often be greater on
the NPhi than on the RhoB".
|
Figure 6: Electrofacies of a fine dolosparite, dolograinstone, oil bearing
in black box A and gas bearing in black box B. |
Dolomites generally have better petrophysical properties (porosity and permeability) in terms of reservoir than the limestones (see some examples below). Dolomitization is probably the reason why Angolan Pinda reservoirs are better than those of the Congolese Sendji or the Brazilian Riachuelo. In theory, the replacement of calcite by dolomite in a closed system should result in an increase of the porosity by approximately 13% (with an initial volume of calcite equal to 100% and a final volume of dolomite equal to 86.8%), but it would be only some 6% for the replacement of aragonite by dolomite, as expressed in the following formula and tables.
2 CaCO3 (solid) + Mg++ (in brine) → MgCO3, CaCO3 (solid) + Ca++ (in brine)
| Calcite (CaCO3) | Dolomite (CaCO3, MgCO3) | |
| number of moles | 2 | 1 |
| molar mass (g) | 100.087 | 184.401 |
| density (g/cm3) | 2.711 | 2.876 |
| volume* (cm3) | 73.84 | 64.12 |
| ratio (volumes) | 100 | 86.8 |
* the computed volumes result from the number of moles multiplied by the molar mass and divided by the density.
| Aragonite (CaCO3) | Dolomite (CaCO3, MgCO3) | |
| number of moles | 2 | 1 |
| molar mass (g) | 100.087 | 184.401 |
| density (g/cm3) | 2.93 | 2.876 |
| volume* (cm3) | 68.32 | 64.12 |
| ratio (volumes) | 100 | 93.8 |
Porosity
created by calcite-to-dolomite replacement is mostly intercrystalline (Pl. 4 ![]() ,
figs. 3, 9 & 12). The size of resulting dolomite crystals is closely
connected to that of the replaced mud or grains: dolomicrite for the mudstone
matrix of mud-supported fabrics and
dolosparite for the grain-supported fabrics. The sizes of the pore throats are
directly related to those of the surrounding dolomite crystals: dolomicrites
(former mudstones) have low permeability values whereas some dolosparites
(former grainstones) may be called "super-K zones" because they reach very
high permeability values.
,
figs. 3, 9 & 12). The size of resulting dolomite crystals is closely
connected to that of the replaced mud or grains: dolomicrite for the mudstone
matrix of mud-supported fabrics and
dolosparite for the grain-supported fabrics. The sizes of the pore throats are
directly related to those of the surrounding dolomite crystals: dolomicrites
(former mudstones) have low permeability values whereas some dolosparites
(former grainstones) may be called "super-K zones" because they reach very
high permeability values.
In
dolomite facies, high porosity is mostly found in intervals with vuggy porosity.
Vugs resulting from the dissolution of calcitic remains after dolomitization may
be well-connected in dolosparites or poorly-connected in dolomicrites.
Intracrystalline porosity ("Russian-doll" rhombic crystals) may add some
more porosity (Pl. 2 ![]() , figs. 16-18; Pl. 4
, figs. 16-18; Pl. 4 ![]() , fig. 15;
Pl. 6
, fig. 15;
Pl. 6 ![]() ,
fig. 3). Anhydrite
commonly occurs in dolomite facies as a late cement in vugs. This adversely impacts porosity and permeability, which is reflected in
porosity and density log values.
,
fig. 3). Anhydrite
commonly occurs in dolomite facies as a late cement in vugs. This adversely impacts porosity and permeability, which is reflected in
porosity and density log values.
The
combination of petrographic observations using a standard polarizing microscope
with transmitted light, crossed polars, reflected light with a "white card" (Pl. 2 ![]() , figs. 3, 6, 9, 12, 15 & 18), eventually supplemented by
cathodoluminescence analyses (Pl. 6
, figs. 3, 6, 9, 12, 15 & 18), eventually supplemented by
cathodoluminescence analyses (Pl. 6 ![]() , figs. 2, 5, 8, 11,
14-15 & 17-19; Pl. 7
, figs. 2, 5, 8, 11,
14-15 & 17-19; Pl. 7 ![]() , figs. 2, 5, 8, 11, 14 & 17), allows discrimination of dolomite replacement (reddish brown, locally with inclusions) leading to
a porosity increase from late dolomite (dull), calcite (orange and yellow) and
anhydrite (non-luminescent) cementations leading to a porosity decrease.
, figs. 2, 5, 8, 11, 14 & 17), allows discrimination of dolomite replacement (reddish brown, locally with inclusions) leading to
a porosity increase from late dolomite (dull), calcite (orange and yellow) and
anhydrite (non-luminescent) cementations leading to a porosity decrease.
The
section below documents some typical electrofacies displays (useful for "quick
look" log interpretations, e.g.,
see Ballay, 2014) with a summary of their petrophysical and
petrographical characteristics. The corresponding microfacies are illustrated in
an attached set of plates (Pls. 1 ![]() -2
-2 ![]() - 3
- 3 ![]() - 4
- 4 ![]() - 5
- 5 ![]() - 6
- 6 ![]() - 7
- 7 ![]() ).
).
|
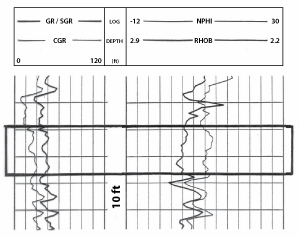
Figure
7:
Electrofacies of a
dolomicrosparite, dolomudstone (in the black box). |
|
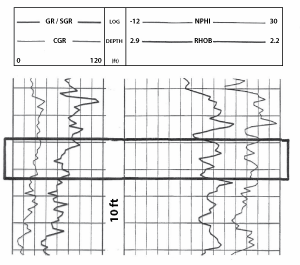
Figure
8:
Electrofacies of a dolomicrosparite, dolowackestone (in the black
box). |
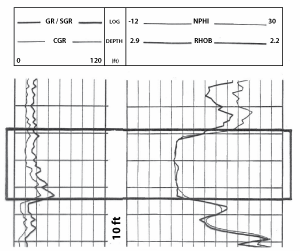
|
Figure
9:
Electrofacies of a coarse dolosparite, dolograinstone (in the
black box). |
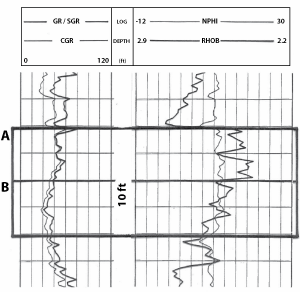
|
Figure
10:
Electrofacies of a sandy dolosparite, dolograinstone, in black
box A, and of a dolomitic sandstone, in black box B. |
|
Figure
11:
Electrofacies of a limestone (in the black box). |
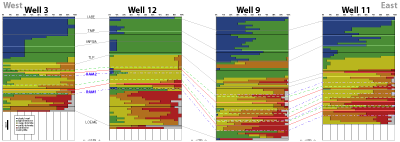
Besides
"quick look" log interpretations, some computer programs allow automatic
computation of approximate lithologies (e.g.,
Stark, 1991; Mathis,
1993, inter
alia). For example, the lithologies of the four wells (A, B, C, and D)
computed for each 50-foot interval are displayed below (Fig.
12 ![]() ). These wells
are arranged on a West to East transect (from left to right). Correlations made using either seismic or radioactive
markers document some
discrepancies. For example, the interpretation of the logs for the middle and
upper Pinda of the second well westward (i.e.,
well 12) suggests more shaliness than expected. The quality of the
interpretations may vary from one well to the other because they rely on too
many factors including the generation of the tools used or the formation fluids.
). These wells
are arranged on a West to East transect (from left to right). Correlations made using either seismic or radioactive
markers document some
discrepancies. For example, the interpretation of the logs for the middle and
upper Pinda of the second well westward (i.e.,
well 12) suggests more shaliness than expected. The quality of the
interpretations may vary from one well to the other because they rely on too
many factors including the generation of the tools used or the formation fluids.
|
Figure
12:
Correlation of computed electrofacies of wells 3, 9 and 11-12
based on Base Iabe, TMP, MPSM, TLP, 2 RadioActive Markers and Top Loeme Salt. |
Unless
calibrated and fully interpreted well logs are deemed necessary to get the best
picture of the reservoirs, as for instance in Eichenseer et al.
(1999: Fig. 7 C), both processes are not prerequisites
to correlate wells. For instance, the seismic markers of the middle-upper Pinda
that are defined in the non-reservoir Moita Seca or Punja facies are easily
correlated solely on the basis of log signature. One of the main features of
both facies is the occurrence of rhythms, probably Milankovitch's
astronomically controlled cycles, which enables us to identify new, informal,
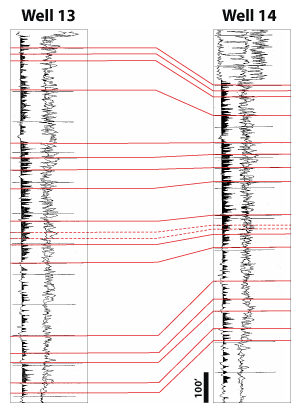
secondary markers on the well logs (Fig. 13 ![]() ). Such peak-to-peak correlation is eventually
useful where seal facies interfinger with reservoir facies (Fig.
14
). Such peak-to-peak correlation is eventually
useful where seal facies interfinger with reservoir facies (Fig.
14 ![]() ).
).
|
Figure
13:
Peak-to-peak correlations in the upper middle and upper Pinda
intervals for wells 13-14. |
|
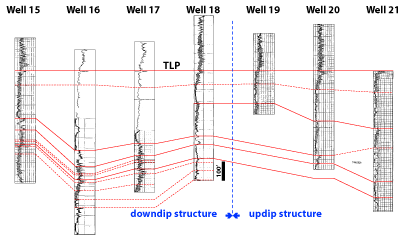
Figure 14: Peak-to-peak correlations in the upper lower and lower middle Pinda intervals for wells 15 to 21. |
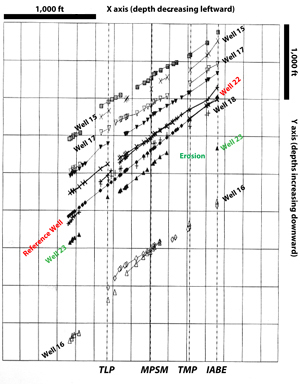
At this stage, an X-Y graph, similar to the "Line of Correlation (LoC)" diagram originally developed by Shaw (1964) for biostratigraphic correlations, may be used to cross-plot common lithologic markers between wells (e.g., Busnardo & Granier, 2011). Relevant results are obtained with this technique in basinal, platform interior and ramp settings. Angolan examples will be discussed in a forthcoming publication (Granier, nearing completion).
The markers of the well selected as the reference well are indicated on the horizontal X axis and those of the correlated wells within the same structure or from discrete structures are plotted on the vertical Y axis. The (X,Y) dots of each well versus the reference well are connected and result in a more or less straight line. Non-linear patterns allow identification of:
No angular correction is required and both vertical and deviated wells can be plotted on the diagram in the same manner. However, the apparent values of the extra or missing thicknesses should be corrected for well bore angle and bed dip effects.
|
Figure
15:
LoC for wells of one structure (see comments in the text). The
reference well (well 22) corresponds to the grey rectangles and well 23 to the
white triangles. The erosion at the top of the Pinda in well 23 can be
estimated at approximately 500 feet (this value has to be corrected for both
the borehole deviation and the structural dip angle). |
|
|
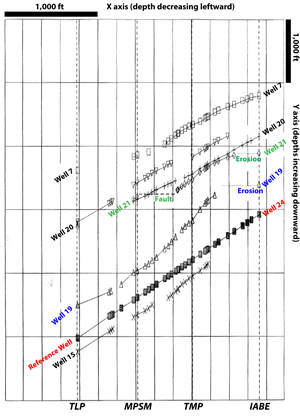
Figure
16:
LoC for wells of another structure (see comments in the text).
The reference well (well 24) corresponds to the grey rectangles, well 19 to
the white triangles and well 21 to the white diamonds. The erosion at the top
of the Pinda in wells 19 and 21 can be estimated at approximately 500 and 200
feet respectively. In addition,
due to a fault occurrence in well 21, approximately 200 feet of upper middle
Pinda section are missing (these values have to be corrected for both the
borehole deviation and the structural dip angle). |
When taking into account the facies of Bufalo or Pacassa reservoirs, cyclicity is still present but less easy to define due to local erosional or nondepositional gaps at sequence boundaries (SB). In this case high-resolution correlations are often a matter of interpretation (e.g., Granier, 1990 et seq., versus Eichenseer et al., 1999). However, there are still some solid arguments: 1) the lithologic trends, i.e., coarsening- or fining-, thickening- or thinning- upward trends, and radioactivity (GR), density (RhoB), and porosity (NPhi) trends, and 2) the points for trend reversals at transgressive surfaces (TS) and at maximum flooding surfaces (MFS). The SB identification could be a critical issue but ascribing discrete HST and LST labels to the lower and upper parts of a regressive interval does not necessarily make the correlation stronger.
Integrated lithostratigraphic approaches, such as that conducted on the Pinda, always result in significant improvements in the understanding of the reservoirs. Interpretation pitfalls and dry holes, which may result from the use of seismic data only, may be avoided. Upper Aptian-Albian dolomite reservoirs, presently the Angolan Pinda dolomite reservoirs, are far better in terms of porosity and permeability than the limestone reservoirs in similar tectono-stratigraphic settings in Angola, Brazil or Congo. The integrated Pinda model drafted herein will be developed further in forthcoming publications (Granier, nearing completion).
The author (B.G.) would like to thank Sonangol for having granted permission through an agreement dated April 13th, 2017, to use some of their material in this publication. He is very grateful to Isabel Policarpo da Silva and Jean Colsoul who acted as facilitators in the agreement with Sociedade Nacional de Combustíveis de Angola Empresa Pública – Sonangol E.P. He also aknowledges the early support of Cécile Pabian-Goyheneche who introduced him to the geology of the Pinda Group some thirty years ago when he was doing a summer internship with elf-Aquitaine in Pau (Granier, 1985; Pabian-Goyheneche et al., 1986). Special thanks go to R.E. "Gene" Ballay for comments on "quick look" interpretations of well logs and to Phil Salvador for checking the final English version. Dimas Dias-Brito translated the abstract into Portuguese. The author is solely responsible for the interpretations and opinions expressed here, which do not necessarily reflect those of Sonangol nor of Total (or the late elf).
Ballay R.E. (2014).- Eyes wide shut.- GeoNeurale, Munich, 34 p. URL: http://www.geoneurale.com/documents/EyesWideShut.pdf
Busnardo R. & Granier B. (2011).- Aptian ammonites of Abu Dhabi (United Arab Emirates) [Ammonites aptiennes d'Abou Dabi (Émirats Arabes Unis)].- Carnets Geol., Madrid, vol. 11, no. L04 (CG2011_L04), p. 117-135.
Eichenseer H.T., Walgenwitz E R. & Biondi P.J. (1999).- Stratigraphic control on facies and diagenesis of dolomitized sequences (Pinda Group, Albian, offshore Angola).- AAPG Bulletin, vol. 83, no. 11, p. 1729-1758.
Ferré B. & Granier B. (2001).- Albian roveacrinids from the southern Congo Basin off Angola.- Journal of South American Earth Sciences, vol. 14, p. 219-235.
Granier B. (1985, unpublished).- Codification macrolithologique de carottes appliquée ŕ l'étude du réseau macroporeux - Application au réservoir Pinda inférieur du champ de Palanca (Angola).- Société Nationale elf-Aquitaine (Production), Rapport de Stage, Pau, 28 p.
Granier B. (1990, unpublished).- Nouvelle nomenclature stratigraphique (séquentielle) de l'Albien de l'offshore angolais. Implications sédimentologiques et structurales.- Rapport SCOP 6, Société Nationale elf-Aquitaine (Production), Pau, 14 p.
Granier B. (1991a, unpublished).- Application des concepts de la stratigraphie séquentielle ŕ l'étude des réservoirs albiens (Pinda) du bloc 2, Angola.- Total, Saint-Rémy-lčs-Chevreuse, Mémo CST/CARB 91-129.
Granier B. (1991b, unpublished).- Tentative d'établissement d'un modčle sédimentologique du Pinda sur la moitié sud du bloc 2, offshore angolais (60 puits).- Total, Saint-Rémy-lčs-Chevreuse, Mémo CST/CARB 91-208.
Granier B. (1992, unpublished).- Tentative d'établissement d'un modčle sédimentologique du Pinda (Albo - ? Cénomanien) sur la moitié sud du bloc 2 (50 puits), offshore angolais.- Total, Rapport Laboratoires no. 4850, Saint-Rémy-lčs-Chevreuse, vol. I (text): 28 p.; vol. II (figures and appendices).
Granier B. & Dias-Brito D. (2016).- On the fossil alga Marinella lugeoni Pfender, 1939, nom. cons., and its seven unfortunate avatars. Revision of the Juliette Pfender Collection. Part 2. Revision of the Jesse Harlan Johnson Collection. Part 2.- Carnets Geol., Madrid, vol. 16, no. 7, p. 231-245.
Granier B. & Goy G. (1993, unpublished).- Pinda Formation, Block 2, Offshore Angola. Catalogue of microfacies of the Lower and Middle Pinda Formation, based on the cored intervals from 22 wells.- Total, Rapport Laboratoires no. 5143, Saint-Rémy-lčs-Chevreuse, 10 p. (50 Pls.).
Granier B., Goy G. & Imbert P. (1993, unpublished).- Pinda Formation, Block 2, Offshore Angola. Regional overview, based on the (re)appraisal of core analyses from 22 wells.- Total, Rapport Laboratoires no. 5126, Saint-Rémy-lčs-Chevreuse, vol. I (text): 56 p. ; vol. II (appendices); vol. III (11 Pls.).
Kochhann K.G.D., Koutsoukos E.A.M., Fauth G. & Sial A.N. (2013).- Aptian - Albian planktic foraminifera from DSDP Site 364 (offshore Angola): biostratigraphy, paleoecology, and paleoceanographic significance.- Journal of Foraminiferal Research, Lawrence, vol. 43, no. 4, p. 443-463.
Koutsoukos E.A.M., Mello M.R., Filho N.C. de Azambuja, Hart M.B. & Maxwell J.R. (1991).- The upper Aptian-Albian succession of the Sergipe basin, Brazil: an integrated paleoenvironmental assessment.- AAPG Bulletin, vol. 75, no. 3, p. 479-498.
Masse P. (1995).- Calcareous algae and microcoprolites of the Albian platform carbonates of the Congo margin.- Bulletin du Centre de Recherches Exploration-Production elf-Aquitaine, Pau, vol. 19, no. 2, p. 301-317.
Mathis B. (1993).- Well logging and diagenesis: case studies and new means of research.- Bulletin du Centre de Recherches Exploration-Production elf-Aquitaine, Pau, vol. 17, no. 2, p. 385-393.
Pabian-Goyheneche C., Sehans P. & Granier B. (1986, unpublished).- Gisements du Pinda d'Angola (Volet Géologie). Codification lithologique et microtectonique de carottes appliquée au réseau poreux du réservoir carbonaté vacuolaire de Palanca.- Société Nationale elf-Aquitaine (Production), Rapport EP/S/EXP/RAG/Lab.Pau no. 86/138RS, 20 p.
Romanes M.F. (1916).- XVI. Note on an algal limestone from Angola.- Transactions of the Royal Society of Edinburgh, vol. LI, part III, no. 16, p. 581-584 (Pl.).
Shaw A.B. (1964).- Time in stratigraphy.- McGraw-Hill, New York, 365 p.
Stark D.M. (ed., 1991).- Avaliaçăo de formaçőes de Angola.- Well Evaluation Conference, Schlumberger, 95 + 55 + 73 + 66 + 40 p.
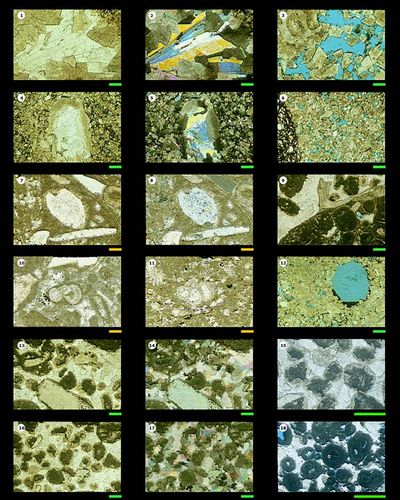
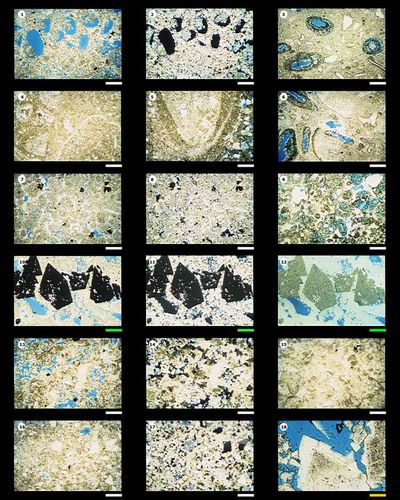
Plate 1: 1. baroque dolomite and anhydrite cement, TL; 2. as above, PL; 3. dolograinstone with a dolomitized gastropod shell. Porosity is intercrystalline to vuggy, TL; 4. echinid cavity infilled with anhydrite cement, TL; 5. as above, PL; 6. dolograinstone with intercrystalline porosity, TL; 7. quartz grain with salt-rich inclusions, TL; 8. as above, PL; 9. lithoclast encrusted by oysters, TL; 10. Favusella washitensis, TL; 11. Favusella washitensis, TL; 12. dolograinstone with intercrystalline and vuggy (moldic) porosity. Bitumen, TL; 13. partly dolomitized oolitic grainstone with echinoderm remains, TL; 14. as above, PL; 15. partly dolomitized oolitic grainstone, TL; 16. partly dolomitized oolitic grainstone, TL; 17. as above, PL; 18. partly dolomitized oolitic grainstone, TL. Scale bars: green 500 µm; orange 125 µm. TL transmitted light; PL polarized light (analyzed); RL reflected light; CL cathodoluminescence. For confidentiality purposes the sample depths and the name of wells are not provided. |
|
|
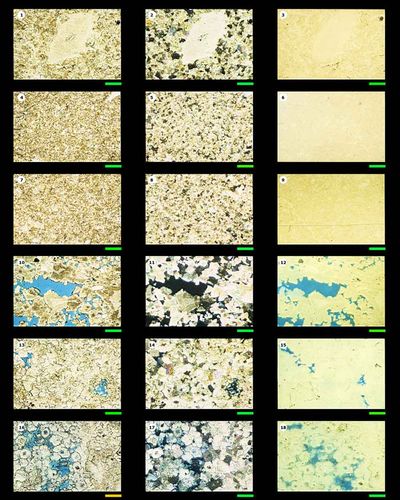
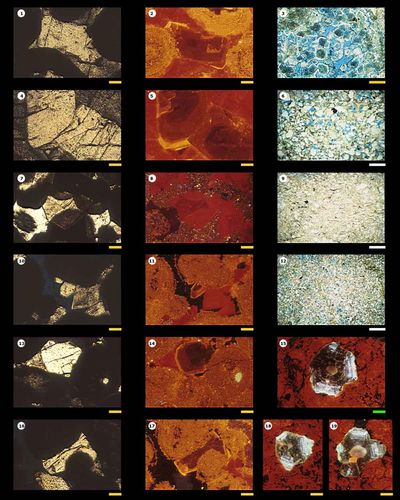
Plate 2: 1. dolograinstone (sucrosic mosaic) with echinoid spine, TL; 2. as above, PL; 3. as above, RL; 4. fine dolograinstone, TL; 5. as above, PL; 6. as above, RL; 7. fine dolograinstone, TL; 8. as above, PL; 9. as above, RL; 10. dolograinstone with moldic porosity, TL; 11. as above, PL; 12. as above, RL; 13. dolograinstone with moldic porosity, TL; 14. as above, PL; 15. as above, RL; 16. intracrystalline porosity, TL; 17. as above, PL; 18. as above, RL. Scale bars: green 500 µm; orange 125 µm. TL transmitted light; PL polarized light (analyzed); RL reflected light; CL cathodoluminescence. For confidentiality purposes the sample depths and the name of wells are not provided. |
|
|
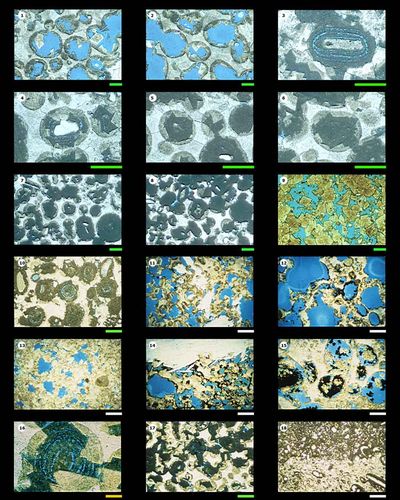
Plate 3: 1. dolograinstone with moldic porosity, TL; 2. dolograinstone with moldic porosity, TL; 3. micritic ooid in a partly dolomitized oolitic grainstone, TL; 4. partly dolomitized oolitic grainstone, TL; 5. partly dolomitized oolitic grainstone, TL; 6. partly dolomitized oolitic grainstone, TL; 7. partly dolomitized oolitic grainstone, TL; 8. partly dolomitized oolitic grainstone, TL; 9. dolograinstone with intercrystalline porosity, TL; 10. partly dolomitized oolitic grainstone, TL; 11. dolograinstone with moldic porosity and anhydrite cement, TL; 12. dolograinstone with moldic porosity. Bitumen, TL; 13. dolograinstone with intercrystalline and moldic porosity, TL; 14. dolograinstone with intercrystalline and moldic porosity, and anhydrite cement. Bitumen, TL; 15. dolograinstone with moldic porosity. Bitumen, TL; 16. micritic ooid in a partly dolomitized oolitic grainstone, TL; 17. partly dolomitized oolitic grainstone, TL; 18. contact between a dolomitized and non dolomitized facies, TL. Scale bars: white 1000 µm; green 500 µm; orange 125 µm. TL transmitted light; PL polarized light (analyzed); RL reflected light; CL cathodoluminescence. For confidentiality purposes the sample depths and the name of wells are not provided. |
|
|
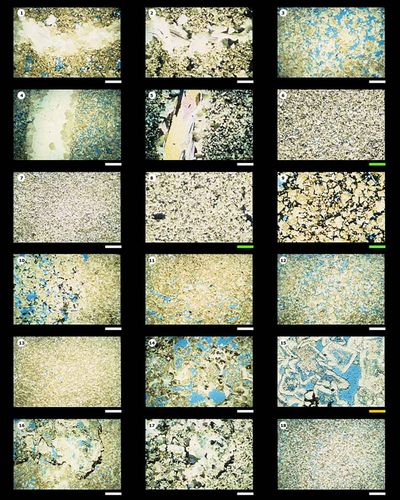
Plate 4: 1. anhydrite cement, TL; 2. as above, PL; 3.dolograinstone with intercrystalline porosity, TL; 4. anhydrite cement, TL; 5. as above, PL; 6. silty mudstone with intercrystalline porosity, TL; 7. silty mudstone, TL; 8. silty mudstone, TL; 9. dolograinstone with intercrystalline porosity. Bitumen, TL; 10. dolograinstone with intercrystalline porosity, TL; 11. fine dolograinstone with intercrystalline porosity, TL; 12. fine dolograinstone with intercrystalline porosity, TL; 13. silty mudstone, TL; 14. dolograinstone with intercrystalline and moldic porosity, TL; 15. intracrystalline porosity, TL; 16. stylolites in dolograinstone, TL; 17. as above, PL; 18. silty mudstone, TL. Scale bars: white 1000 µm; green 500 µm; orange 125 µm. TL transmitted light; PL polarized light (analyzed); RL reflected light; CL cathodoluminescence. For confidentiality purposes the sample depths and the name of wells are not provided. |
|
|
Plate 5: 1. dolograinstone with intercrystalline and moldic porosity, TL; 2. as above, PL; 3. dolowackestone with moldic porosity, TL; 4. pelecypod, TL; 5. pelecypod, TL; 6. dolowackestone with pelecypods and oncoids, TL; 7. dolograinstone with intercrystalline porosity, TL; 8. as above, PL; 9. dolograinstone with intercrystalline and moldic porosity, TL; 10. pyrite, TL; 11. as above, PL; 12. as above, RL; 13. dolograinstone with intercrystalline and moldic porosity, TL; 14. as above, PL; 15. tight dolograinstone, TL; 16. sandy dolograinstone with intercrystalline and moldic porosity, TL; 17. as above, PL; 18. dolomite crystal showing both replacement and cement stages, TL. Scale bars: white 1000 µm; green 500 µm; orange 125 µm. TL transmitted light; PL polarized light (analyzed); RL reflected light; CL cathodoluminescence. For confidentiality purposes the sample depths and the name of wells are not provided. |
|
|
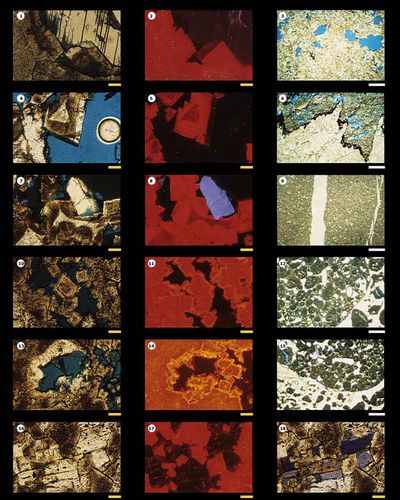
Plate 6: 1. calcite and dolomite cement in an intergranular position, TL; 2. as above, CL; 3. intracrystalline porosity, TL; 4. calcite and dolomite cement in an intergranular position, TL; 5. as above, CL; 6. sandy dolograinstone with intercrystalline porosity, TL; 7. dolomite cement in an intergranular position, TL; 8. as above, CL; 9. silty dolomudstone, TL; 10. calcite and dolomite cement in an intergranular position, TL; 11. as above, CL; 12. silty dolomudstone with intercrystalline porosity, TL; 13. calcite and dolomite cement in an intergranular position, TL; 14. as above, CL; 15. sphalerite (considered to be of hydrothermal origin), CL; 16. calcite and dolomite cement in an intergranular position, TL; 17. as above, CL; 18. sphalerite, CL; 19. sphalerite, CL. Scale bars: white 1000 µm; green 500 µm; orange 125 µm. TL transmitted light; PL polarized light (analyzed); RL reflected light; CL cathodoluminescence. For confidentiality purposes the sample depths and the name of wells are not provided. |
|
|
Plate 7: 1. anhydrite and dolomite crystals showing both replacement and cement stages, TL; 2. as above, CL; 3. dolograinstone with moldic porosity, TL; 4. dolomite crystal showing both replacement and cement stages, TL; 5. as above, CL; 6. stylolite, TL; 7. feldspar and dolomite crystal showing both replacement and cement stages, TL; 8. as above, CL; 9. dolomudstone with cemented fracture, TL; 10. zoned dolomite crystals, TL; 11. as above, CL; 12. lithoclast, TL; 13. zoned dolomite crystals, TL; 14. as above, CL; 15. lithoclast, TL; 16. dolomite crystals cemented by anhydrite, TL; 17. as above, CL; 18. as above, PL. Scale bars: white 1000 µm; orange 125 µm. TL transmitted light; PL polarized light (analyzed); RL reflected light; CL cathodoluminescence. For confidentiality purposes the sample depths and the name of wells are not provided. |
|