![]()
Contents
[Introduction] [Material and methods]
[Results]
[Interpretation and discussion]
[Conclusion]
[Bibliographic references] [Figures] and ... [Tables]
(Sortable tables: [Table 2] & [Table 3])
![]()
The Total Organic Carbon (TOC) content of the Gargasian strata studied in their historical stratotype area is rather low (0.3% on average). Only a few levels show TOC values approaching 1.2%. This small amount of preserved organic matter, associated with low hydrogen index values (10 to 115 mg hydrocarbons/g TOC), argues for deposition in fully oxic conditions. This organic content is a mixture of land-derived organic particles and deeply oxidized marine organic matter. The organic flux was strongly diluted by the autochthonous carbonate input.
Lower Cretaceous; Middle Aptian; Gargasian; stratotype; organic matter; Total Organic Carbon.
F., M., & G. (2008).- Characterisation of the organic matter of upper Bedoulian and lower Gargasian strata in the historical stratotypes (Apt and Cassis-la-Bédoule areas, SE France).- Carnets de Géologie / Notebooks on Geology, Brest, Letter 2008/01 (CG2008_L01)
Caractérisation de la matière organique du Bédoulien supérieur et du Gargasien dans les stratotypes historiques de l'Aptien (régions d'Apt et de Cassis-la Bédoule, SE de la France).- Les teneurs en Carbone Organique Total (COT) des couches gargasiennes étudiées dans leur région stratotypique historique sont faibles (0,3% en moyenne), à l'exception de quelques niveaux où les teneurs atteignent 1,2%. Ces faibles quantités de matière organique préservée, associées à des faibles valeurs de l'index d'hydrogène (10 à 115 mg d'hydrocarbures/g COT), suggèrent un dépôt en conditions oxiques franches. Cette contribution organique au sédiment est un mélange de particules d'origine terrestre et d'une biomasse marine fortement oxydée. Ces maigres apports organiques étaient fortement dilués par les flux de carbonate biogène autochtone.
Crétacé inférieur ; Aptien moyen ; Gargasien ; stratotype ; matière organique ; Carbone Organique Total.
This study is part of a revision of the Gargasian (Middle Aptian) beds in both their historical stratotype area and the Bedoulian (lower Aptian) type locality. The interval which spans the Bedoulian-Gargasian transition is well developed and exposed in these areas, particularly in the vicinity of Apt (Vaucluse) and of Cassis-La Bédoule (near Marseille, Bouches-du-Rhône, SE France). In many other areas of the world this transition is rather poorly recorded in condensed sections or in sequences affected by hiatuses.
Multidisciplinary studies, including sedimentological, paleontological and geochemical approaches, have already been made on the Gargasian of the
type localities mentioned above ( et alii,
2007; et alii,
2007; et alii,
2004, 2005, 2006,
2008; et alii,
2007). The aim here is to investigate the organic carbon content of three sections located in these regions
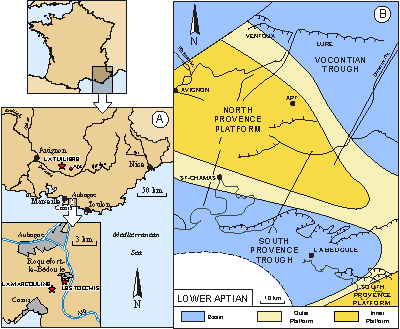
(Fig. 1B ![]() ):
):
The areas of Cassis-La Bédoule and Apt are separated by approximately one hundred kilometres, and during the Early Aptian
(Fig. 1B ![]() ) were two discrete paleogeographic domains The area of Cassis-La Bédoule was located in an intracratonic basin, named the "Sillon Sud-Provençal" ( & ,
1976) whereas the Apt area was on the northern edge of the North-Provence platform.
) were two discrete paleogeographic domains The area of Cassis-La Bédoule was located in an intracratonic basin, named the "Sillon Sud-Provençal" ( & ,
1976) whereas the Apt area was on the northern edge of the North-Provence platform.
For more precise data concerning the geographical location, lithological description and stratigraphic relationships of these sections, see et alii (2007), & (2004) and et alii (2004, 2005, 2006). The biostratigraphy based on planktonic and benthic foraminifera is detailed in et alii (2005, 2008).
In term of organic matter sedimentation, the Gargasian interval represents the interlude between two major OAEs: the lower Aptian (Bedoulian) OAE 1a and the OAE 1b which spans the Aptian/Albian boundary and represents a protracted interval of dysoxia with a number of discrete black shales levels (, 1987; et alii, 2002).
Eight samples were selected from the Les Tocchis section, and in the La Marcouline section every clayey-limestone bed and marly interbed (ninety samples) was analysed. Twenty-four samples from the La Tuilière-Pichouraz section complete the data set.
The total organic carbon (TOC) content, as well as the source and thermal maturation of the organic matter were measured using a Rock-Eval instrument, Oil Show Analyser device ( et alii, 1985a, 1985b, 1986). Standard notations are used: TOC is given as weight %, S1 and S2 are in mg hydrocarbons (HC) per g of dry sediment and Tmax is expressed in °C. The hydrogen index (HI=S2/TOCx100) is expressed in mg HC per g of TOC.
Rock-Eval analyses were duplicated for sixteen samples and triplicated for three samples in order to check the reproducibility and reliability of the results. The precision for S2 measurement is ± 0.02 mg HC/g rock and ± 0.03% for TOC content.
The eight samples from Les Tocchis section show a low content of organic carbon with TOC ranging from 0.05 to 0.30% (0.15% on average). Their hydrogen index (HI) values range between 15 and 80 mg HC/g TOC
(Table 1 ![]() ). For the La Tuilière-Pichouraz section the range of organic carbon content averages 0.15 whereas the maximum for HI values is only 60 mg HC/g TOC
(Table 2
). For the La Tuilière-Pichouraz section the range of organic carbon content averages 0.15 whereas the maximum for HI values is only 60 mg HC/g TOC
(Table 2 
![]() ). In the La Marcouline section the organic carbon content fluctuates between 0.02 and 1.2% (0.30% on average). The HI values range from 12 to 115 mg HC/g TOC, with an average of 52
(Table 3
). In the La Marcouline section the organic carbon content fluctuates between 0.02 and 1.2% (0.30% on average). The HI values range from 12 to 115 mg HC/g TOC, with an average of 52
(Table 3 ![]() ).
).
Free (S1) and pyrolyzable (S2) hydrocarbons are present in all the samples, albeit in very low quantities. The mean S2 value is 0.18 mg HC.g-1 and the maximum reaches 1.37 mg HC.g-1 in interbed 79 of La Marcouline section.
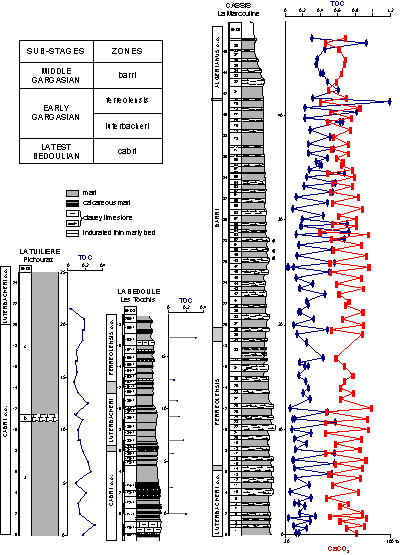
The vertical (stratigraphic) distribution of the organic-carbon content is shown in
Figure 2 ![]() . The uppermost part of the Bedoulian succession (i.e. the lower part of the Pichouraz section and beds 171 and 174 at Les Tocchis) contains little organic matter (~ 0.2% TOC). Such a low organic content occurs also in the basal part of the Gargasian (eighteen samples analysed in the topmost Schackoina gr. cabri
Zone and the Praehedbergella luterbacheri Zone in both Les Tocchis and La Marcouline sections). A slight increase in organic matter is noted in the marly interbed near the base (but not the lowest beds) of the Gargasian Globigerinelloides ferreolensis
Zone (up to 0.5-0.6% TOC in interbeds 13, 15, 17, 23 and 25 of La Marcouline section), whereas the clayey-limestone beds are organic-poor (~ 0.10% TOC). In the La Marcouline section
(Fig. 2
. The uppermost part of the Bedoulian succession (i.e. the lower part of the Pichouraz section and beds 171 and 174 at Les Tocchis) contains little organic matter (~ 0.2% TOC). Such a low organic content occurs also in the basal part of the Gargasian (eighteen samples analysed in the topmost Schackoina gr. cabri
Zone and the Praehedbergella luterbacheri Zone in both Les Tocchis and La Marcouline sections). A slight increase in organic matter is noted in the marly interbed near the base (but not the lowest beds) of the Gargasian Globigerinelloides ferreolensis
Zone (up to 0.5-0.6% TOC in interbeds 13, 15, 17, 23 and 25 of La Marcouline section), whereas the clayey-limestone beds are organic-poor (~ 0.10% TOC). In the La Marcouline section
(Fig. 2 ![]() ),
the mean TOC content in the limestones ranges between 0.15 and 0.25% . In the La Marcouline section there is a general increase in organic matter in both limestones and marls throughout the Middle Gargasian Globigerinelloides barri
Zone (Fig. 2
),
the mean TOC content in the limestones ranges between 0.15 and 0.25% . In the La Marcouline section there is a general increase in organic matter in both limestones and marls throughout the Middle Gargasian Globigerinelloides barri
Zone (Fig. 2 ![]() ). A mean TOC content in the limestones varies between 0.15 and 0.25% from the base to the top of this zone, whereas in the marly interbeds the mean TOC content increases, ranging between 0.40 and 0.65%. The highest organic content recorded is near the top of the Globigerinelloides barri
Zone (1.20% TOC in interbed 79). The organic carbon content decreases to around 0.40% in the Globigerinelloides ferreolensis
Zone.
). A mean TOC content in the limestones varies between 0.15 and 0.25% from the base to the top of this zone, whereas in the marly interbeds the mean TOC content increases, ranging between 0.40 and 0.65%. The highest organic content recorded is near the top of the Globigerinelloides barri
Zone (1.20% TOC in interbed 79). The organic carbon content decreases to around 0.40% in the Globigerinelloides ferreolensis
Zone.
Information on the thermal evolution of the organic matter can be obtained by pyrolytic measurements ( et alii,
1985a). Tmax values are relatively low (~ 421°C on average), for samples having a S2 peak higher than 0.1 mg.g-1
(Tables 1 ![]() - 2
- 2 ![]() - 3
- 3 ![]() ). This indicates that the organic matter was not subject to high temperature during burial and is still immature with respect to petroleum generation. This is in agreement with the moderate diagenesis caused by burial as deduced by et alii
(2007) from both the low dissolution of calcareous nannofossils and the absence of overgrowths on carbonate particles in limestones and marls from the La Marcouline section. Such a moderate diagenesis suggests the Rock-Eval parameters (TOC, HI) represent a primary signal that reflect the environmental changes during the deposition of Gargasian strata.
). This indicates that the organic matter was not subject to high temperature during burial and is still immature with respect to petroleum generation. This is in agreement with the moderate diagenesis caused by burial as deduced by et alii
(2007) from both the low dissolution of calcareous nannofossils and the absence of overgrowths on carbonate particles in limestones and marls from the La Marcouline section. Such a moderate diagenesis suggests the Rock-Eval parameters (TOC, HI) represent a primary signal that reflect the environmental changes during the deposition of Gargasian strata.
Total Organic Carbon (TOC) content is a bulk sedimentary parameter that represents the fraction of organic matter that has survived degradation during both sinking in the water column and early diagenesis in the sediments. This parameter reflects the quantity of organic matter, but it should be kept in mind that organically bound oxygen, hydrogen, sulphur and nitrogen can contribute up to 50% of the total sedimentary organic matter. In immature samples, 1% TOC corresponds to 1.5 to 2.0% organic matter ( & , 1984).
Concentrations of organic carbon in the samples vary between 0.05% and 1.20%, with a mean value around 0.30%. Such a mean value is in the range of average values compiled for Recent marine sediments deposited in oxic pelagic conditions (, 1995). The Gargasian organic-poor rocks certainly reflect similar conditions of low productivity and poor preservation of organic matter, as previously suggested by (1997) who made an extensive study of the organic matter of Aptian and Albian strata in SE France. One exception is the dark-coloured layers, occurring at interbeds 77 and 79 of La Marcouline section, in which TOC concentrations reach 0.8-1.2%. These levels may be the premise of a small enrichment in organic matter which appear in the Globigerinelloides ferreolensis Zone and is fully developed in the so-called "niveau Fallot", as defined by (1987) in the nearby Vocontian Basin.
Because TOC content is expressed in weight %, it is influenced by the relative concentration of all the other components in a sedimentary rock, such as carbonate, silicate (including clay minerals and biogenic silica), and iron-sulphide (mainly pyrite). For example, TOC contents may be diluted by siliciclastic or carbonate particles in some settings or concentrated by the dissolution of carbonate in others.
For the La Marcouline section, calcium carbonate content measurements are available ( et alii,
2007). This allows a comparison of the distribution of organic in relation to the carbonate content. It appears that the increase of TOC in the Globigerinelloides barri
Zone is due mainly to a concomitant decrease of calcium carbonate
(Fig. 2 ![]() ).
).
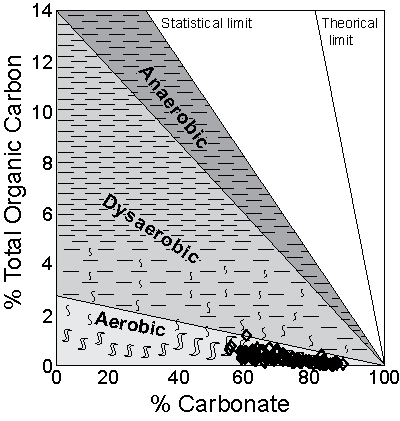
To identify the main component causing the differences in the relative quantitities of carbonate and organic matter in these limestones and marls, the characteristic TOC-CaCO3 crossplot may be used (,
1993). On
Figure 3 ![]() , there is a negative relationship between the percentages of carbonate and organic carbon. Such a linear relationship, with a weak negative slope, suggests that variations in carbonate input may largely explain changes in the content of organic matter. These changes might have been due to fluctuations either in the primary productivity or in the rate of dissolution of the carbonate deposited, both of which would repeatedly lower or increase the relative percentage of organic carbon to carbonate in the sediment at the time of deposition.
, there is a negative relationship between the percentages of carbonate and organic carbon. Such a linear relationship, with a weak negative slope, suggests that variations in carbonate input may largely explain changes in the content of organic matter. These changes might have been due to fluctuations either in the primary productivity or in the rate of dissolution of the carbonate deposited, both of which would repeatedly lower or increase the relative percentage of organic carbon to carbonate in the sediment at the time of deposition.
But as et alii (2007) found no evidence of dissolution in calcareous nannofossils, it seems reasonable to assume that the limestone-marl alternations are the result of changes in carbonate supply. Consequently, the small enrichment in organic matter of the more marly samples is mainly the consequence of a relative increase in detrital+organic matter input; the organic matter representing almost 1.1wt% (between 0.2 and 2.6%) of this non carbonate fraction.
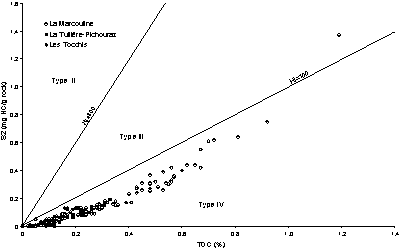
Although the type of organic matter is first determined by elemental analysis, the hydrogen index (HI) parameter approximates the H/C atomic ratio which is a determinant for the recognition of the type of organic matter ( & ,
1984). However, mineral matrix effects (e.g., adsorption on clay mineral surfaces of hydrocarbons generated during pyrolysis) can generate low HI values regardless of the type of organic matter. This effect is of minor importance here, as shown by the regression line of our samples which cuts the TOC axis near the origin of the diagram, indicating a low adsorption of pyrolytic effluents
(Fig. 4 ![]() ). According to the low range of HI values (1 to 115 mg HC/g TOC), the organic matter of the samples may be attributed to Type IV
(Fig. 4
). According to the low range of HI values (1 to 115 mg HC/g TOC), the organic matter of the samples may be attributed to Type IV
(Fig. 4 ![]() ). Only the richest sample falls in the field of Type III organic matter
(Fig. 4
). Only the richest sample falls in the field of Type III organic matter
(Fig. 4 ![]() ). Type III is usually related to terrestrial higher plant debris, whereas Type IV is indicative of residual deeply altered organic matter. As hydrogen-rich organic matter (Type I or II) is
oxidized, its hydrogen content decreases while its oxygen content increases, and it may take on Rock-Eval characteristics of Type III organic matter ( et alii,
1985a, 1985b, 1986).
). Type III is usually related to terrestrial higher plant debris, whereas Type IV is indicative of residual deeply altered organic matter. As hydrogen-rich organic matter (Type I or II) is
oxidized, its hydrogen content decreases while its oxygen content increases, and it may take on Rock-Eval characteristics of Type III organic matter ( et alii,
1985a, 1985b, 1986).
The small amount of organic matter in our material, associated with low HI values, argues for deposition in fully oxic waters. However, anoxic conditions were developed within the sediment as pyrite is ubiquitous in all the studied interval. Consequently, the small increase in relative quantity and quality of sedimentary organic matter in marly interbed is probably the result of a slightly enhanced preservation of organic matter, mainly land-derived organic matter (Type III) and the non-metabolizable fraction of marine organic matter (Type IV).
As previously mentioned, the areas of Cassis-La Bédoule and Apt were in discrete paleogeographic domains during the Early Aptian
(Fig. 1B ![]() ). Despite this difference in environment, the organic carbon content of the Bedoulian-Gargasian transition is similar at both sites. Although the La Tuilière-Pichouraz-Les Gays section is much more clayey, and therefore presumably prone to a larger percentage of organic matter
- because organic matter is usually enriched in clayey environments ( & ,
1984) -, the organic content is like that at Les Tocchis. The absence of an appreciable difference in the organic content of the successions in the two areas may be due to the higher rate of sedimentation at La Tuilière than at Cassis-La Bédoule where it is already
high ( et alii, 2005).
). Despite this difference in environment, the organic carbon content of the Bedoulian-Gargasian transition is similar at both sites. Although the La Tuilière-Pichouraz-Les Gays section is much more clayey, and therefore presumably prone to a larger percentage of organic matter
- because organic matter is usually enriched in clayey environments ( & ,
1984) -, the organic content is like that at Les Tocchis. The absence of an appreciable difference in the organic content of the successions in the two areas may be due to the higher rate of sedimentation at La Tuilière than at Cassis-La Bédoule where it is already
high ( et alii, 2005).
The Total Organic Carbon (TOC) content of the Gargasian strata in their historical stratotype area is rather low (0.3% on average). This small quantity of preserved organic matter, associated with low HI values (50 mg HC/g TOC in average), argues for their original deposition in fully oxic waters, even if anoxic conditions were developed within the sediment later, thus allowing the formation of pyrite. Only few levels have a higher content of organic matter, with TOC values approaching 1.2%. This organic matter is a mixture of land-derived organic particles and a deeply oxidized marine organic material. Plot of TOC% versus CaCO3% suggests a decrease of TOC content with increasing CaCO3 content. This negative correlation implies dilution of organic matter by the autochthonous carbonate supply (i.e. the accumulation of calcareous nannofossils) is the main factor controlling variations in organic content throughout the sedimentary sequence.
We are grateful to Florence for her efficient technical assistance. We thank Armelle and Richard who provided helpful comments that improved the manuscript. Special thanks are due Nestor for language corrections and improved readability of the text.
J.-F., M. & G. (2007).- The upper Bedoulian and lower Gargasian Ostracoda of the Aptian stratotype: Taxonomy and biostratigraphic correlation.- Carnets de Géologie / Notebooks on Geology, Brest, Article 2007/05 (CG2007_A05), 36 p.
C., M., M. de, M. & G. (2007).- Environmental changes during marl-limestone formation: evidence from the Gargasian (Middle Aptian) of La Marcouline Quarry (Cassis, SE France).- Carnets de Géologie / Notebooks on Geology, Brest, Article 2007/01 (CG2007_A01), 13 p.
J.G. (1997).- L'Aptien et l'Albien de la fosse Vocontienne (des bordures au bassin). Évolution de la sédimentation et enseignements sur les évènements anoxiques.- Thèse Doctorat ès Sciences de l'Université de Tours.- Publications de la Société Géologique du Nord, Lille, vol. 25, 614 p.
J., G. & F. (1985a).- La pyrolyse Rock-Eval et ses applications.- Revue de l'Institut Français du Pétrole, Rueil-Malmaison, 40, (5), p. 563-579.
J., G. & F. (1985b).- La pyrolyse Rock-Eval et ses applications.- Revue de l'Institut Français du Pétrole, Rueil-Malmaison, 40, (6), p. 755-784.
J., G. & F. (1986).- La pyrolyse Rock-Eval et ses applications.- Revue de l'Institut Français du Pétrole, Rueil-Malmaison, 41, (1), p. 73-89.
G. (1987).- Dynamique du Bassin subalpin méridional de l'Aptien au Cénomanien.- Mémoire des Sciences de la Terre, École des Mines de Paris, n° 4, 370 p.
R.M., T.J. & R. (2002).- Oceanic anoxic events and plankton evolution: Biotic response to tectonic forcing during the mid-Cretaceous.- Paleoceanography, Washington, vol. 17, n° 3, 1041 doi:10.1029/2001PA000623.
J.-P. & J. (1976).- Paléogéographie du Crétacé moyen en Provence : révision du concept d'isthme durancien.- Revue de Géographie Physique et Géologie Dynamique, Paris, vol. 18, n° 1, p. 49-66.
M. & G. (2004).- The Gargasian (Middle Aptian) substage in the Aptian historical stratotypes (SE France): General introduction.- Carnets de Géologie / Notebooks on Geology, Maintenon, Letter 2004/01 (CG2004_L01), 3 p.
M., G., C. & G. (2006).- The Gargasian (Middle Aptian) of La Tuilière St-Saturnin-lès-Apt (area of the Aptian historical stratotype, Vaucluse, SE France): geographic setting and outcrop correlation.- Carnets de Géologie / Notebooks on Geology, Brest, Letter 2006/01 (CG2006_L01), 8 p.
M., G. & J.-P. (2005).- The Gargasian (Middle Aptian) of Cassis-La Bédoule (Lower Aptian historical stratotype, SE France): planktonic and benthic foraminiferal assemblages and biostratigraphy.- Carnets de Géologie / Notebooks on Geology, Brest, Article 2005/02 (CG2005_A02), 20 p.
M., G. & J.-P. (2008). - Associations et biostratigraphie des Foraminifères benthiques et planctoniques du Bédoulien sommital et du Gargasien inférieur de La Tuilière - St-Saturnin-lès-Apt (aire stratotypique de l'Aptien, Vaucluse, SE France).- Carnets de Géologie / Notebooks on Geology, Brest, Article 2008/01 (CG2008_A01), 50 p.
M., G., W., M. & J.-P. (2004).- The Gargasian (Middle Aptian) of Cassis-La Bédoule (Lower Aptian historical stratotype, SE France): geographic location and lithostratigraphic correlations.- Carnets de Géologie / Notebooks on Geology, Brest, Letter 2004/02 (CG2004_L02), 4 p.
M., M. de, L., C., M. & G. (2007).- Inorganic geochemistry of the Gargasian from La Marcouline quarry (Cassis, France).- Carnets de Géologie / Notebooks on Geology, Brest, Article 2007/01 (CG2007_A01), 28 p.
W. (1993).- Sedimentation as a three components system: organic carbon, carbonate, noncarbonate.- Lectures Notes in Earth Sciences, Berlin, 51, 211 p.
B. & D.H. (1984).- Petroleum formation and occurrence.- Springer Verlag, 669 p.
R.V. (1995).- Sedimentary organic matter: organic facies and palynofacies.- Chapman & Hall, 615 p.
Click on thumbnail to enlarge the image.
Figure 1: 1A: Location of the studied sections near Cassis-La Bédoule and Apt, area of the Gargasian historical stratotype. 1B: Paleogeographical scheme of Southern Provence during early Aptian.
Click on thumbnail to enlarge the image.
Figure 2: Lithologic profiles of the studied sections and vertical distribution of the total organic carbon content (TOC, in weight %). The CaCO3 percentages (in wt%) along the La Marcouline section are from et alii (2007).
Click on thumbnail to enlarge the image.
Figure 3: Carbonate vs. organic carbon (TOC) content of the Gargasian strata relative to the idealized pattern of bioturbation and bottom water oxygenation given by (1993).
Click on thumbnail to enlarge the image.
Figure 4: Kerogen type in the Gargasian strata as defined by the cross-plot of TOC and pyrolysis S2 parameter.
| Sample | Tmax °C |
S1 mg/g |
S2 mg/g |
≤ TOC % |
HI mg HC/g TOC |
| 171cT | 425 | 0.05 | 0.12 | 0.22 | 54 |
| 174T | nd | 0.07 | 0,00 | 0.04 | nd |
| 180T | nd | 0.03 | 0.01 | 0.05 | 20 |
| 183T | nd | 0.07 | 0.07 | 0.17 | 41 |
| 186T | nd | 0.03 | 0.03 | 0.12 | 25 |
| 189T | nd | 0.05 | 0.02 | 0.10 | 20 |
| 193T | nd | 0.05 | 0.01 | 0.06 | 16 |
| 198T | 416 | 0.08 | 0.17 | 0.31 | 54 |
Table 1: Rock-Eval pyrolysis results of the Les Tocchis section. nd: not determined. Tmax is not determined for S2 peaks below 0.1 mg/g. HI is not determined for S2 = 0 mg/g or TOC = 0.05%.
| Sample | Tmax | S1 | S2 | ≤ TOC | HI |
| 2270 | nd | 0.01 | 0.07 | 0.17 | 41 |
| 2271 | 421 | 0.01 | 0.15 | 0.31 | 48 |
| 2272 | nd | 0.01 | 0.06 | 0.14 | 42 |
| 2273 | nd | 0.02 | 0.07 | 0.12 | 58 |
| 2274 | 415 | 0.02 | 0.13 | 0.21 | 61 |
| 2275 | nd | 0.03 | 0.04 | 0.09 | 44 |
| 2276 | 416 | 0.01 | 0.14 | 0.26 | 53 |
| 2277 | 418 | 0.01 | 0.11 | 0.23 | 47 |
| 2278 | nd | 0.01 | 0.06 | 0.17 | 35 |
| 2279 | nd | 0.01 | 0.03 | 0.14 | 21 |
| 2280 | nd | 0.00 | 0.00 | 0.12 | nd |
| 2281 | nd | 0.04 | 0.07 | 0.17 | 41 |
| 2282 | nd | 0.02 | 0.02 | 0.08 | 25 |
| 2283 | nd | 0.01 | 0.03 | 0.10 | 30 |
| 2284 | 414 | 0.03 | 0.10 | 0.23 | 43 |
| 2285 | nd | 0.01 | 0.02 | 0.12 | 16 |
| 2286 | nd | 0.01 | 0.02 | 0.07 | 28 |
| 2287 | nd | 0.01 | 0.01 | 0.10 | 10 |
| 2288 | nd | 0.03 | 0.04 | 0.11 | 36 |
| 2289 | nd | 0.01 | 0.02 | 0.10 | 20 |
| 2290 | nd | 0.03 | 0.07 | 0.17 | 41 |
| 2291 | nd | 0.03 | 0.06 | 0.19 | 31 |
| 2292 | nd | 0.02 | 0.07 | 0.19 | 36 |
| 2293 | nd | 0.01 | 0.00 | 0.04 | nd |
Click on the table to open its sortable version (Remark: it works only with Mozilla Firefox or Camino!).
Table 2: Rock-Eval pyrolysis results of the composite La Tuilière-Pichouraz section. nd: not determined. Tmax is not determined for S2 peaks below 0.1 mg/g. HI is not determined for S2 = 0 mg/g or TOC = 0.05%.
| Sample | Bed | Tmax | S1 | S2 | ≤ TOC | HI |
| 1 | 1 | nd | 0.03 | 0.07 | 0.15 | 46 |
| 2 | 1 | 416 | 0.03 | 0.11 | 0.24 | 45 |
| 3 | 2 | nd | 0.03 | 0.03 | 0.09 | 33 |
| 4 | 3 | 420 | 0.02 | 0.13 | 0.28 | 46 |
| 5 | 4 | nd | 0.11 | 0.01 | 0.03 | 33 |
| 6 | 5 | 423 | 0.05 | 0.16 | 0.34 | 47 |
| 7 | 6 | nd | 0.03 | 0.06 | 0.16 | 37 |
| 8 | 7 | 417 | 0.04 | 0.11 | 0.22 | 50 |
| 9 | 8 | nd | 0.02 | 0.04 | 0.10 | 40 |
| 10 | 9 | 415 | 0.04 | 0.16 | 0.29 | 55 |
| 11 | 10 | nd | 0.03 | 0.05 | 0.05 | nd |
| 12 | 11 | 419 | 0.04 | 0.13 | 0.27 | 48 |
| 13 | 12 | nd | 0.03 | 0.03 | 0.11 | 27 |
| 14 | 13 | 422 | 0.03 | 0.26 | 0.53 | 49 |
| 15 | 14 | nd | 0.03 | 0.05 | 0.10 | 50 |
| 16 | 15 | 423 | 0.03 | 0.33 | 0.56 | 58 |
| 17 | 16 | nd | 0.02 | 0.03 | 0.08 | 37 |
| 18 | 17 | nd | 0.02 | 0.32 | 0.56 | 57 |
| 19 | 18 | nd | 0.02 | 0.05 | 0.11 | 45 |
| 20 | 19 | 416 | 0.02 | 0.09 | 0.24 | 37 |
| 21 | 20 | nd | 0.02 | 0.04 | 0.10 | 40 |
| 22 | 21 | 419 | 0.02 | 0.12 | 0.29 | 41 |
| 23 | 22 | nd | 0.01 | 0.03 | 0.07 | 42 |
| 24 | 23 | 424 | 0.04 | 0.36 | 0.57 | 63 |
| 25 | 24 | nd | 0.02 | 0.02 | 0.10 | 20 |
| 26 | 25 | 420 | 0.04 | 0.27 | 0.48 | 56 |
| 27 | 26 | nd | 0.02 | 0.00 | 0.05 | nd |
| 28 | 27 | 420 | 0.02 | 0.14 | 0.28 | 50 |
| 29 | 28 | 417 | 0.03 | 0.13 | 0.20 | 65 |
| 30 | 29 | 422 | 0.03 | 0.13 | 0.26 | 50 |
| 31 | 30 | 420 | 0.03 | 0.11 | 0.23 | 47 |
| 32 | 31 | nd | 0.04 | 0.07 | 0.15 | 46 |
| 33 | 31 | 419 | 0.03 | 0.11 | 0.26 | 42 |
| 34 | 32 | nd | 0.02 | 0.06 | 0.16 | 37 |
| 35 | 33 | 418 | 0.04 | 0.28 | 0.43 | 65 |
| 36 | 33 | 422 | 0.02 | 0.11 | 0.24 | 45 |
| 37 | 34 | nd | 0.01 | 0.04 | 0.13 | 30 |
| 38 | 35 | 422 | 0.03 | 0.30 | 0.48 | 62 |
| 39 | 36 | nd | 0.03 | 0.05 | 0.09 | 55 |
| 40 | 37 | 419 | 0.03 | 0.17 | 0.32 | 53 |
| 41 | 38 | nd | 0.03 | 0.08 | 0.17 | 47 |
| 42 | 39 | 420 | 0.04 | 0.12 | 0.26 | 46 |
| 43 | 40 | 419 | 0.06 | 0.13 | 0.24 | 54 |
| 44 | 41 | 424 | 0.06 | 0.31 | 0.45 | 68 |
| 45 | 42 | 419 | 0.04 | 0.09 | 0.16 | 56 |
| 46 | 43 | 422 | 0.03 | 0.18 | 0.31 | 58 |
| 47 | 44 | nd | 0.04 | 0.05 | 0.12 | 41 |
| 48 | 45 | 422 | 0.05 | 0.32 | 0.50 | 64 |
| 49 | 46 | nd | 0.02 | 0.00 | 0.03 | nd |
| 50 | 47 | 424 | 0.05 | 0.42 | 0.56 | 75 |
| 51 | 48 | nd | 0.05 | 0.07 | 0.13 | 53 |
| 52 | 49 | 423 | 0.04 | 0.39 | 0.53 | 73 |
| 53 | 50 | nd | 0.04 | 0.09 | 0.15 | 60 |
| 54 | 51 | 428 | 0.04 | 0.55 | 0.67 | 82 |
| 55 | 52 | nd | 0.11 | 0.06 | 0.12 | 50 |
| 56 | 53 | 428 | 0.06 | 0.62 | 0.72 | 86 |
| 57 | 54 | 420 | 0.05 | 0.10 | 0.18 | 55 |
| 58 | 55 | 428 | 0.03 | 0.61 | 0.70 | 87 |
| 59 | 56 | 418 | 0.02 | 0.12 | 0.19 | 63 |
| 60 | 57 | 420 | 0.05 | 0.27 | 0.43 | 62 |
| 61 | 58 | nd | 0.03 | 0.01 | 0.08 | 12 |
| 62 | 59 | 424 | 0.06 | 0.37 | 0.48 | 77 |
| 63 | 60 | nd | 0.03 | 0.03 | 0.12 | 25 |
| 64 | 61 | 426 | 0.05 | 0.31 | 0.54 | 57 |
| 65 | 62 | nd | 0.04 | 0.08 | 0.21 | 38 |
| 66 | 63 | 422 | 0.06 | 0.35 | 0.57 | 61 |
| 67 | 64 | nd | 0.03 | 0.08 | 0.24 | 33 |
| 68 | 65 | 423 | 0.04 | 0.42 | 0.67 | 62 |
| 69 | 66 | nd | 0.02 | 0.09 | 0.27 | 33 |
| 70 | 67 | 418 | 0.05 | 0.17 | 0.41 | 41 |
| 71 | 68 | 414 | 0.03 | 0.15 | 0.35 | 42 |
| 72 | 69 | 418 | 0.04 | 0.25 | 0.48 | 52 |
| 73 | 70 | nd | 0.03 | 0.09 | 0.26 | 34 |
| 74 | 71 | 420 | 0.04 | 0.30 | 0.55 | 54 |
| 75 | 72 | 417 | 0.05 | 0.13 | 0.26 | 50 |
| 76 | 73 | 421 | 0.04 | 0.28 | 0.51 | 54 |
| 77 | 74 | 417 | 0.03 | 0.15 | 0.28 | 53 |
| 78 | 75 | 423 | 0.04 | 0.44 | 0.62 | 70 |
| 79 | 76 | 416 | 0.02 | 0.11 | 0.22 | 50 |
| 80 | 77 | 426 | 0.04 | 0.64 | 0.81 | 79 |
| 81 | 78 | 420 | 0.03 | 0.13 | 0.22 | 59 |
| 82 | 79 | 429 | 0.05 | 1.37 | 1.19 | 115 |
| 83 | 80 | 417 | 0.04 | 0.17 | 0.31 | 54 |
| 84 | 81 | 422 | 0.05 | 0.40 | 0.60 | 66 |
| 85 | 82 | 421 | 0.08 | 0.31 | 0.48 | 64 |
| 86 | 83 | 419 | 0.03 | 0.24 | 0.43 | 55 |
| 87 | 85 | 422 | 0.02 | 0.18 | 0.35 | 51 |
| 88 | 86 | 425 | 0.02 | 0.15 | 0.36 | 41 |
| 89 | 88 | 420 | 0.02 | 0.26 | 0.45 | 57 |
| 90 | 89 | 429 | 0.04 | 0.75 | 0.92 | 81 |
| 91 | 90 | 419 | 0.04 | 0.13 | 0.30 | 43 |
Click on the table to open its sortable version (Remark: it works only with Mozilla Firefox or Camino!).
Table 3: Rock-Eval pyrolysis results of the La Marcouline section. nd: not determined. Tmax is not determined for S2 peaks below 0.1 mg/g. HI is not determined for S2 = 0 mg/g or TOC = 0.05%.